• About
  • Elliott Waves
    • Elliott Waves Explained
    • Elliott Wave Magic Illustrated with Wave Charts
    • Elliott Wave Edge – How Elliott Wave Traders Win
    • Fibonacci Number Series and Elliott Waves
    • How to use Fibonacci Ratio Retracements
    • Elliott Wave Books
      • The Elliott Wave Book – Five Waves to Financial Freedom
      • Dividend Growth Investing Using Elliott Waves
    • Videos
  • Equities
    • Indices
      • Africa
        • Egypt
      • Australia
      • European Indices
        • AEX – Index, Amsterdam
        • DAX Index
        • Istanbul
        • Russia
        • Spain’s IBEX 35
      • Asian Indices
        • India
        • China
        • Dubai
        • Kuwait
        • Kuala Lumpur
        • Pakistan
        • Saudi
        • Taiwan
      • US Indices
        • S&P500
        • Nasdaq
        • Dow Jones
        • Dow Jones Utilities
    • Stocks
      • Asian Stocks
        • Indian Stocks Trading
        • Dubai Stocks Outlook
        • Japanese Stocks
        • Kuwait stocks
        • Saudi Stocks Outlook
      • African Stocks
        • Egyptian Stocks
      • Swiss Stocks
      • Australian Stocks
      • European Stocks
      • US Stocks outlook
      • UK Stocks
  • Commodities
    • Copper
    • Gasoline
    • Gold
    • Natural Gas
    • Oil
    • Palm Oil
    • Raw Sugar
    • Rubber
    • Soybean Oil
    • Silver
  • Forex
    • AUD
    • Bitcoin
    • CAD
    • CHF
    • Euro
    • GBP
    • INR
    • NZD
    • JPY
  • Raves
  • Consulting
    • Consulting
  • Ramki’s Watchlist
Top News

Has Meta (Facebook) stock seen the bottom

March 21, 2022

What Is The Nearest Technical Support For Meta (NASDAQ: FB)

February 7, 2022

Using Elliott Waves to Capture a Trade in S&P500

January 27, 2022
Facebook Twitter Instagram
WaveTimes Blog WaveTimes Blog
Wave times
  • About
  • Elliott Waves
    • Elliott Waves Explained
    • Elliott Wave Magic Illustrated with Wave Charts
    • Elliott Wave Edge – How Elliott Wave Traders Win
    • Fibonacci Number Series and Elliott Waves
    • How to use Fibonacci Ratio Retracements
    • Elliott Wave Books
      • The Elliott Wave Book – Five Waves to Financial Freedom
      • Dividend Growth Investing Using Elliott Waves
    • Videos
  • Equities
    • Indices
      • Africa
        • Egypt
      • Australia
      • European Indices
        • AEX – Index, Amsterdam
        • DAX Index
        • Istanbul
        • Russia
        • Spain’s IBEX 35
      • Asian Indices
        • India
        • China
        • Dubai
        • Kuwait
        • Kuala Lumpur
        • Pakistan
        • Saudi
        • Taiwan
      • US Indices
        • S&P500
        • Nasdaq
        • Dow Jones
        • Dow Jones Utilities
    • Stocks
      • Asian Stocks
        • Indian Stocks Trading
        • Dubai Stocks Outlook
        • Japanese Stocks
        • Kuwait stocks
        • Saudi Stocks Outlook
      • African Stocks
        • Egyptian Stocks
      • Swiss Stocks
      • Australian Stocks
      • European Stocks
      • US Stocks outlook
      • UK Stocks
  • Commodities
    • Copper
    • Gasoline
    • Gold
    • Natural Gas
    • Oil
    • Palm Oil
    • Raw Sugar
    • Rubber
    • Soybean Oil
    • Silver
  • Forex
    • AUD
    • Bitcoin
    • CAD
    • CHF
    • Euro
    • GBP
    • INR
    • NZD
    • JPY
  • Raves
  • Consulting
    • Consulting
  • Ramki’s Watchlist
WaveTimes Blog WaveTimes Blog
Home » General Electric rally was anticipated by Elliott Waves
US Stocks outlook

General Electric rally was anticipated by Elliott Waves

RamkiBy RamkiSeptember 17, 20206 Comments2 Mins Read
Facebook Twitter LinkedIn Telegram Pinterest Tumblr Reddit WhatsApp Email
General Electric rally anticipated by Elliott Waves
General Electric Rally
Share
Facebook Twitter LinkedIn Pinterest Email

General Electric  (NYQ:GE) has rallied today by over 4.5%. But this rally was anticipated by Elliott Waves as far back as 22 June 2020. At that time, the stock was trading about the same levels as today, i.e. at $7.04. In an analysis shared with my member, I had suggested that we wait for a dip to $6.67 or max $5.99 and buy that dip for a significant rally. Elliott Wave analysis was suggesting either a wave C or a 3rd wave from one of those levels. Where do you think it went to?

General Electric dipped to $6 on 31 July 2020 and rallied by 11%from there. But that was not the real rally!  We got one more attempt to the downside, making a low of $5.93 on 11 September 2020 and that marked the end of this leg of the bear cycle.

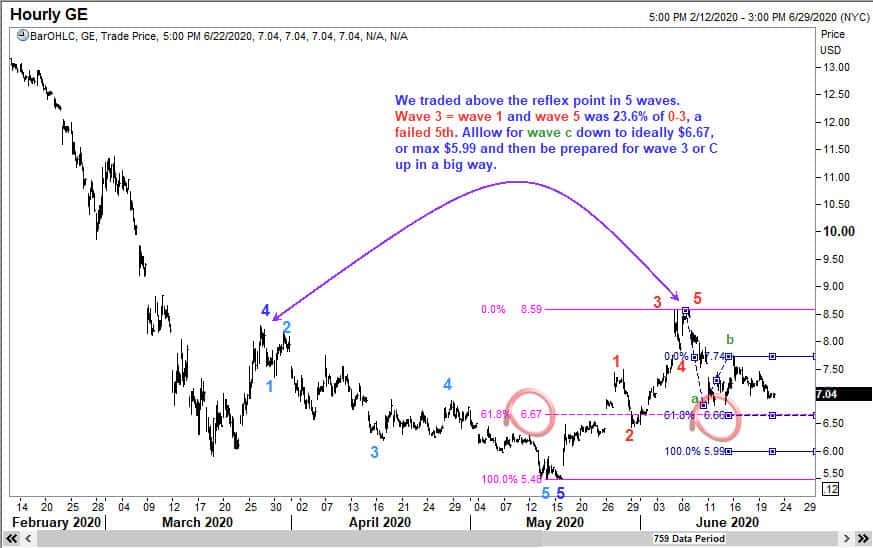
The Elliott Wave chart below shows my rationale for anticipating a big up move in General Electric. If you are interested in learning how to spot such fantastic low-risk entry points, you should look up https://elliottwaves.com. I have published my online educational program that teaches you how to really USE Elliott Waves to profit consistently.

General Electric rally as anticpated.

General Electric rally anticipated by Elliott Waves
General Electric Rally

If you like to see another trade on GE, where I anticipated a rally of 17% using Elliott Waves, it is here.

And my signature online ElliottWaves program is at https://elliottwaves.com/

Elliott Waves GE GE Rally General Electric NYQ: GE
Share. Facebook Twitter Pinterest LinkedIn Tumblr Telegram Email
Previous ArticleAcasti Pharma (NASDAQ:ACST) collapse anticipated by Elliott Waves
Next Article Three Rules of Elliott Wave Principle Explained
Ramki
  • Website

Related Posts

Has Meta (Facebook) stock seen the bottom

March 21, 2022

What Is The Nearest Technical Support For Meta (NASDAQ: FB)

February 7, 2022

Hedge Funds and Elliott Waves – Netflix $NFLX

January 17, 2022
View 6 Comments

6 Comments

  1. Abhinav Yadav on September 26, 2020 7:24 am

    Hi Sir, I just want to know wheather online course include pdf analysis of all past trades which you did and told to your club members? because If we get that we will get more exposure of elliottwaves trades execution by seeing past trades.

    Reply
    • Ramki Ramakrishnan on September 30, 2020 10:17 am

      Abhinav, There are already 14 hours of videos there, much more than any other course in other platforms. Besides, you already know how vastly superior my approach is. I am adding new content at regular intervals and every time you learn something new. When we have more recent cases, why would you want pdf of past trades!! You should already be able to trade confidently even by going over what I have taught you, right?

      Reply
  2. Khalid M on September 27, 2020 7:30 pm

    Hello Mr Ramki

    Are there any signs to help me differentiate between wave 1 whether it is an impulse wave or corrective wave A since both have 5 sub-waves thank.

    Reply
    • Ramki Ramakrishnan on September 30, 2020 10:14 am

      Khalid,
      This question has been addressed in detail in my online program via case studies. Briefly, a new impulse wave comes at the end of a correction. So if you are able to satisfy yourself that the preceding move has been made up of 3 waves (of which the last leg should be in 5 sub waves, being wave c), then you can comfortably anticipate the current 5 wave move in the opposite direction to be a wave 1, However, in my online course, I have taught you how to handle trades when you are operating in an environment of uncertainty. So please revsit that if you have already enrolled.

      Reply
  3. Abhinav Yadav on September 30, 2020 5:55 pm

    Thanks Sir for reply , Actually I am practicing Elliott waves from past 5 years and learned lot from you by your books and free blogs which you provided, and from my experience I am telling that more and more I see charts from your blogs and other sites which post Elliot wave analysis more I get comfortable and correlate things more .
    As there are different cycles and conditions in market in different times , only a person who have seen waves in different cycles(bear, bull, corrective phase) could be more confident in approaching a trade.
    Hence I just suggested idea of past trades pdfs in course..
    Hope you understand my view!
    Thanks

    Reply
    • Ramki Ramakrishnan on October 3, 2020 10:56 am

      Abhinav, Thank you for your suggestion. I might consider this at a future date.

      Reply

Leave A Reply Cancel Reply

Recent Posts
  • Has Meta (Facebook) stock seen the bottom
  • What Is The Nearest Technical Support For Meta (NASDAQ: FB)
  • Using Elliott Waves to Capture a Trade in S&P500
  • Hedge Funds and Elliott Waves – Netflix $NFLX
  • When Elliott Waves applauds the promoter’s signals!

WaveTimes is a Research Organization dedicated to providing original analysis, reports, reviews, and insights on developments in mutual funds, stocks, investing, foreign exchange, commodities, and bonds.

Contact WaveTimes

L-601 Mantri Espana,

Kariyammana Agrahara, Bellandur, Bangalore 560103

Follow Us

  • Facebook
  • YouTube
  • Twitter

© 2023 Wave Times. All Rights Reserved.
  • About
  • Books
  • Privacy Policy
  • Policies and Standards

Type above and press Enter to search. Press Esc to cancel.