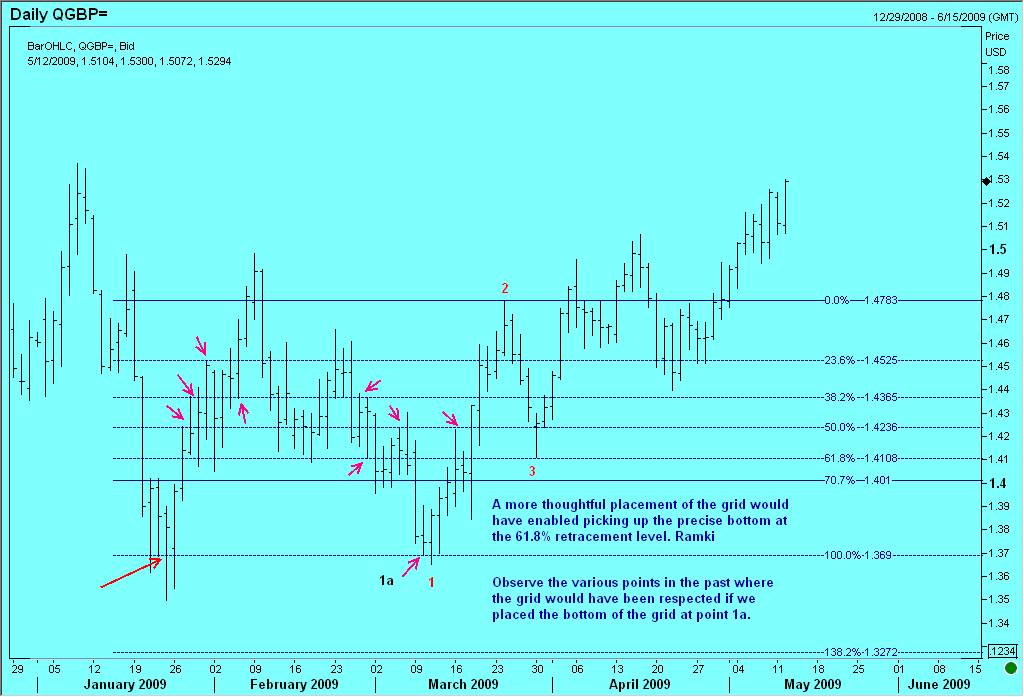
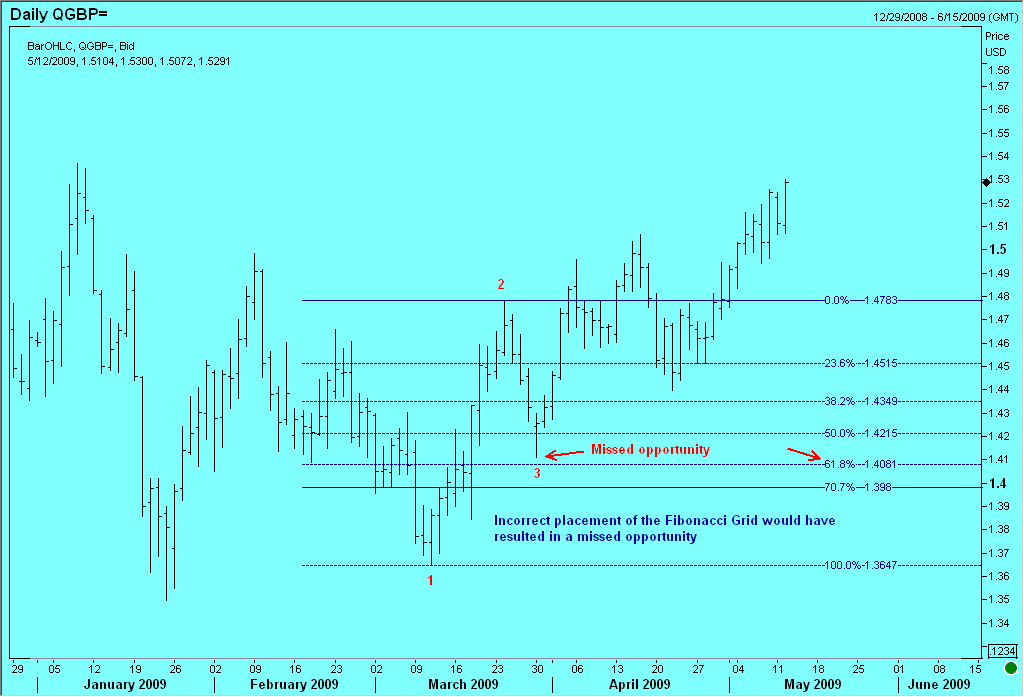
How to use Fibonacci ratio retracements is a topic that every serious trader should look into. A few years back I read a book by Constance Brown – “Technical Analysis for the Trading Professional”. She made a very good point on how the ‘theorist’ among technical analysts would, incorrectly, choose the extremities of a move to draw Fibonacci retracements.
Choosing the right place to draw Fibonacci ratio retracements could mark the difference between success and failure in trading decisions.
Example of an incorrect use Fibonacci Ratio Retracements in real-world trading
Such an approach would often result in their missing a good move because the market falls just short of their ideal retracement levels. The practicing professional would spend a few extra minutes to see what were the pressure points in recent history and choose to ignore the spikes that shows up ever so often. Why make the same mistake as some poor trader whose stops were run in by the market at the extremities?
Examples of how to use Fibonacci Ratio Retracements in real-world trading
Here is a demonstration of the two outcomes using the chart of Sterling Pound. The same technique for using Fibonacci ratio retracements works equally well, whether you are considering the chart of a stock, an index, forex or a commodity. Learning how to use Fibonacci Ratio retracements in Elliott Wave analysis is like winning half the battle.
 The preferred way to draw or use Fibonacci ratio retracements grid
Update on 29 August 2019:
If you are interested in my hugely popular online Elliott Wave Educational/ training program please visit https://elliottwaves.com

