• About
  • Elliott Waves
    • Elliott Waves Explained
    • Elliott Wave Magic Illustrated with Wave Charts
    • Elliott Wave Edge – How Elliott Wave Traders Win
    • Fibonacci Number Series and Elliott Waves
    • How to use Fibonacci Ratio Retracements
    • Elliott Wave Books
      • The Elliott Wave Book – Five Waves to Financial Freedom
      • Dividend Growth Investing Using Elliott Waves
    • Videos
  • Equities
    • Indices
      • Africa
        • Egypt
      • Australia
      • European Indices
        • AEX – Index, Amsterdam
        • DAX Index
        • Istanbul
        • Russia
        • Spain’s IBEX 35
      • Asian Indices
        • India
        • China
        • Dubai
        • Kuwait
        • Kuala Lumpur
        • Pakistan
        • Saudi
        • Taiwan
      • US Indices
        • S&P500
        • Nasdaq
        • Dow Jones
        • Dow Jones Utilities
    • Stocks
      • Asian Stocks
        • Indian Stocks Trading
        • Dubai Stocks Outlook
        • Japanese Stocks
        • Kuwait stocks
        • Saudi Stocks Outlook
      • African Stocks
        • Egyptian Stocks
      • Swiss Stocks
      • Australian Stocks
      • European Stocks
      • US Stocks outlook
      • UK Stocks
  • Commodities
    • Copper
    • Gasoline
    • Gold
    • Natural Gas
    • Oil
    • Palm Oil
    • Raw Sugar
    • Rubber
    • Soybean Oil
    • Silver
  • Forex
    • AUD
    • Bitcoin
    • CAD
    • CHF
    • Euro
    • GBP
    • INR
    • NZD
    • JPY
  • Raves
  • Consulting
    • Consulting
  • Ramki’s Watchlist
Top News

Has Meta (Facebook) stock seen the bottom

March 21, 2022

What Is The Nearest Technical Support For Meta (NASDAQ: FB)

February 7, 2022

Using Elliott Waves to Capture a Trade in S&P500

January 27, 2022
Facebook Twitter Instagram
WaveTimes Blog WaveTimes Blog
Wave times
  • About
  • Elliott Waves
    • Elliott Waves Explained
    • Elliott Wave Magic Illustrated with Wave Charts
    • Elliott Wave Edge – How Elliott Wave Traders Win
    • Fibonacci Number Series and Elliott Waves
    • How to use Fibonacci Ratio Retracements
    • Elliott Wave Books
      • The Elliott Wave Book – Five Waves to Financial Freedom
      • Dividend Growth Investing Using Elliott Waves
    • Videos
  • Equities
    • Indices
      • Africa
        • Egypt
      • Australia
      • European Indices
        • AEX – Index, Amsterdam
        • DAX Index
        • Istanbul
        • Russia
        • Spain’s IBEX 35
      • Asian Indices
        • India
        • China
        • Dubai
        • Kuwait
        • Kuala Lumpur
        • Pakistan
        • Saudi
        • Taiwan
      • US Indices
        • S&P500
        • Nasdaq
        • Dow Jones
        • Dow Jones Utilities
    • Stocks
      • Asian Stocks
        • Indian Stocks Trading
        • Dubai Stocks Outlook
        • Japanese Stocks
        • Kuwait stocks
        • Saudi Stocks Outlook
      • African Stocks
        • Egyptian Stocks
      • Swiss Stocks
      • Australian Stocks
      • European Stocks
      • US Stocks outlook
      • UK Stocks
  • Commodities
    • Copper
    • Gasoline
    • Gold
    • Natural Gas
    • Oil
    • Palm Oil
    • Raw Sugar
    • Rubber
    • Soybean Oil
    • Silver
  • Forex
    • AUD
    • Bitcoin
    • CAD
    • CHF
    • Euro
    • GBP
    • INR
    • NZD
    • JPY
  • Raves
  • Consulting
    • Consulting
  • Ramki’s Watchlist
WaveTimes Blog WaveTimes Blog
Home » Trading General Electric Company using Elliott Waves
US Stocks outlook

Trading General Electric Company using Elliott Waves

RamkiBy RamkiNovember 18, 20192 Comments4 Mins Read
Facebook Twitter LinkedIn Telegram Pinterest Tumblr Reddit WhatsApp Email
Daily chart of General Electric Company
This is a daily chart of General Electric Company
Share
Facebook Twitter LinkedIn Pinterest Email

This post looks at how we can trade General Electric Company (NYSE: GE) using Elliott Waves. The following analysis considers trading General Electric Company stock in the short term.

As explained in my Elliott Wave book, Five Waves to Financial Freedom, we should begin our analysis with the bigger picture. A standard approach that I follow is to use the daily chart as far as possible. You might be trading the short term, but the clues that the daily chart gives us is far more valuable.

What clues does the following daily chart of General Electric give us? Take a look and see if you can figure it out yourself before reading on.

Daily chart of General Electric Company
This is a daily chart of General Electric Company

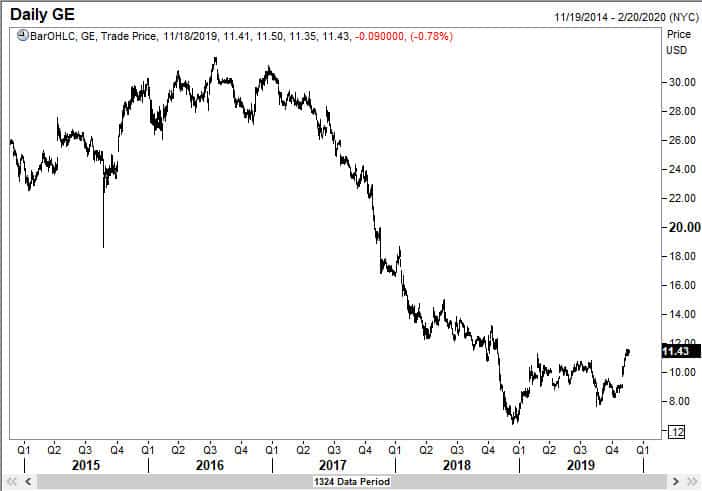
Like most charts, this one too is open to many different interpretations. Do you see five waves down from the top? Great! I can bet there are many who can see just three waves down. The truth is, no one knows for sure how many waves there are. This is what I am teaching you in my on-line program in great detail. 

Anyway,  let us look at the next chart of General Electric where I have drawn a Fibonacci grid. 

General Electric Chart with a Fibonacci grid

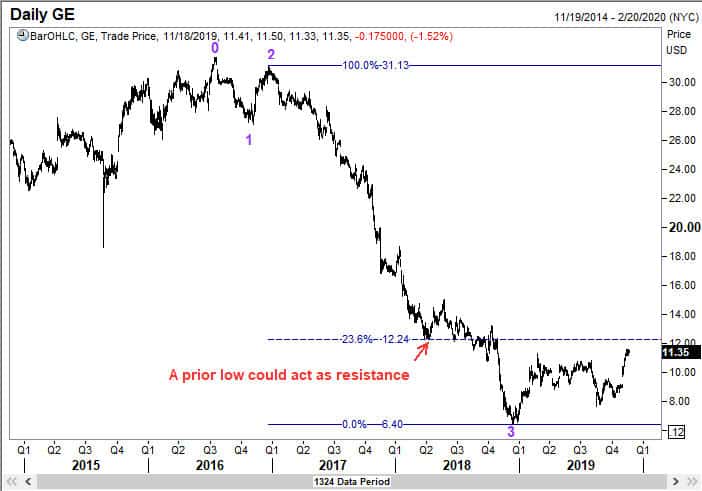
You will observe that the 23.6% retracement , which also happens to be a prior low, comes at $12.24. We should expect a short term resistance there. Next, let us try and figure out where to buy this stock. To do this, we shall look closely at the moves from the significant low of $6.40. We are in the third step higher, and you can see that how I have labeled the chart. The third step higher can thus be a wave 3 or a wave C. It doesn’t matter to the short term trader of General Electric. Either wave should be made up of 5 sub waves.

Wave B or wave 2 of General Electric came down to the 70.7% retracement level
Wave B or wave 2 of General Electric came down to the 70.7% retracement level. We are now in Wave C or Wave 3.

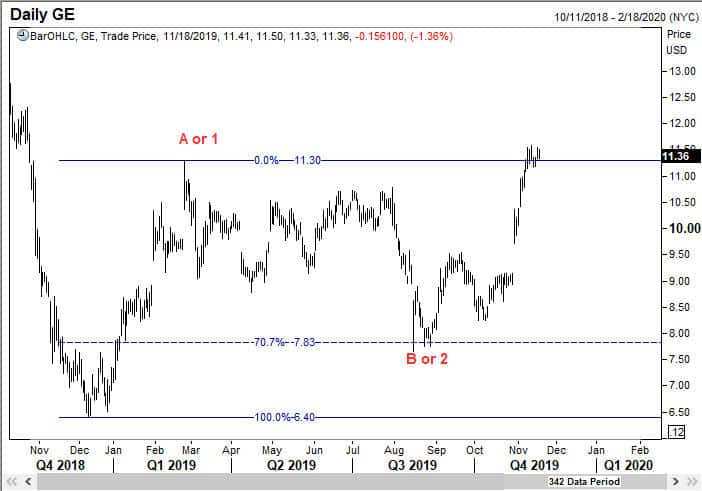
It should be immediately clear to you that we are currently in sub wave 3 of wave C (or wave 3). So we should plan to buy a 38.2% correction when it shows up to capture sub wave 5 of wave C (or wave 3).

Look to buy a sub wave 4 dip to 38.2% of sub wave 3

Obviously we don’t know yet where sub wave 3 will end. But this is where you have to watch the market. Suppose we have already seen the top of sub wave 3. Then the following chart shows how I will approach the trade.

I will buy GE in 2 stages

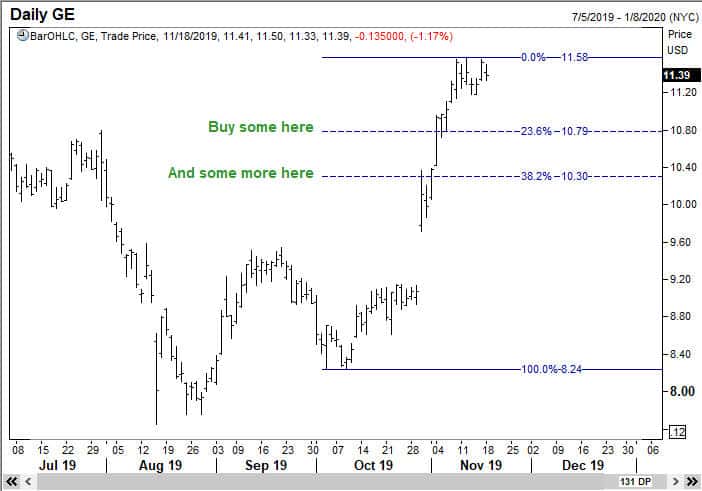
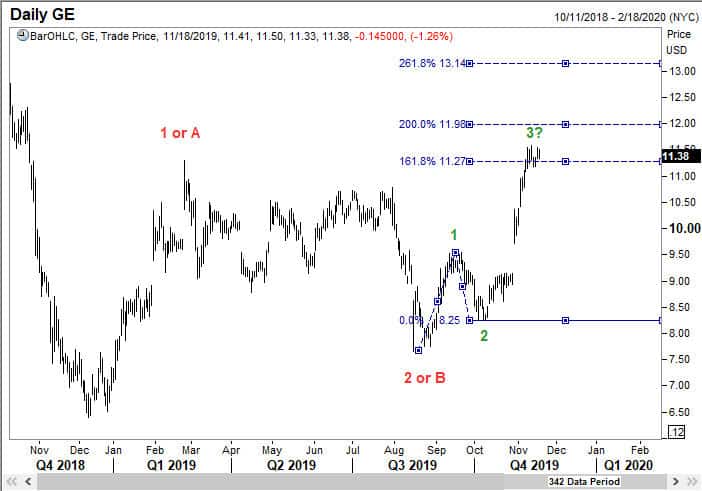
Although it will be a much better deal if I buy at the 38.2% retracement, I get my clues from the speed of the rally. Maybe if I wait for the sweetest spot to buy, I could get left behind! So I will stagger my buying over two levels, at 10.85 and 10.35, giving me an average of 10.60. You can’t do this blindly, and some judgement has to be made. By the way, if wave 3 ends higher than where I have assumed in the above example, you will recompute the buy levels.

Where will I take profits in my General Electric trade? In the example below, I have assumed that sub wave 4 will finish exactly at the 38.2% level of 10.30. In that case, the target for sub wave 5 will be as shown. But I will be more than happy to take a 10% profit on this trade and exit a few cents ahead of the first target.

Like a majority of examples in this free blog, this is a real-time example, and you can see how things will turn out. Of course, I will have stops on the trade. Trading tactics are all explained in detail in my online course. But a basic introduction is available in FWTFF.  I hope this example of trading General Electric Company helps you become a better trader. Good luck.


Share. Facebook Twitter Pinterest LinkedIn Tumblr Telegram Email
Previous ArticleHow we traded EURJPY recently
Next Article How we traded Castrol India using Elliott Waves
Ramki
  • Website

Related Posts

Has Meta (Facebook) stock seen the bottom

March 21, 2022

What Is The Nearest Technical Support For Meta (NASDAQ: FB)

February 7, 2022

Hedge Funds and Elliott Waves – Netflix $NFLX

January 17, 2022
View 2 Comments

2 Comments

  1. Susanta on November 19, 2019 3:49 am

    Sir nifty your view?

    Reply
    • Ramki Ramakrishnan on December 3, 2019 6:09 am

      Susanta, Thank you for writing. I have kept this free blog solely to share my knowledge and experience of Elliott Waves. Please consider joining the exclusive club of wavetimes at https://wavetimes.net , which is a paid service.

      Reply

Leave A Reply Cancel Reply

Recent Posts
  • Has Meta (Facebook) stock seen the bottom
  • What Is The Nearest Technical Support For Meta (NASDAQ: FB)
  • Using Elliott Waves to Capture a Trade in S&P500
  • Hedge Funds and Elliott Waves – Netflix $NFLX
  • When Elliott Waves applauds the promoter’s signals!

WaveTimes is a Research Organization dedicated to providing original analysis, reports, reviews, and insights on developments in mutual funds, stocks, investing, foreign exchange, commodities, and bonds.

Contact WaveTimes

L-601 Mantri Espana,

Kariyammana Agrahara, Bellandur, Bangalore 560103

Follow Us

  • Facebook
  • YouTube
  • Twitter

© 2023 Wave Times. All Rights Reserved.
  • About
  • Books
  • Privacy Policy
  • Policies and Standards

Type above and press Enter to search. Press Esc to cancel.