• About
  • Elliott Waves
    • Elliott Waves Explained
    • Elliott Wave Magic Illustrated with Wave Charts
    • Elliott Wave Edge – How Elliott Wave Traders Win
    • Fibonacci Number Series and Elliott Waves
    • How to use Fibonacci Ratio Retracements
    • Elliott Wave Books
      • The Elliott Wave Book – Five Waves to Financial Freedom
      • Dividend Growth Investing Using Elliott Waves
    • Videos
  • Equities
    • Indices
      • Africa
        • Egypt
      • Australia
      • European Indices
        • AEX – Index, Amsterdam
        • DAX Index
        • Istanbul
        • Russia
        • Spain’s IBEX 35
      • Asian Indices
        • India
        • China
        • Dubai
        • Kuwait
        • Kuala Lumpur
        • Pakistan
        • Saudi
        • Taiwan
      • US Indices
        • S&P500
        • Nasdaq
        • Dow Jones
        • Dow Jones Utilities
    • Stocks
      • Asian Stocks
        • Indian Stocks Trading
        • Dubai Stocks Outlook
        • Japanese Stocks
        • Kuwait stocks
        • Saudi Stocks Outlook
      • African Stocks
        • Egyptian Stocks
      • Swiss Stocks
      • Australian Stocks
      • European Stocks
      • US Stocks outlook
      • UK Stocks
  • Commodities
    • Copper
    • Gasoline
    • Gold
    • Natural Gas
    • Oil
    • Palm Oil
    • Raw Sugar
    • Rubber
    • Soybean Oil
    • Silver
  • Forex
    • AUD
    • Bitcoin
    • CAD
    • CHF
    • Euro
    • GBP
    • INR
    • NZD
    • JPY
  • Raves
  • Consulting
    • Consulting
  • Ramki’s Watchlist
Top News

Has Meta (Facebook) stock seen the bottom

March 21, 2022

What Is The Nearest Technical Support For Meta (NASDAQ: FB)

February 7, 2022

Using Elliott Waves to Capture a Trade in S&P500

January 27, 2022
Facebook Twitter Instagram
WaveTimes Blog WaveTimes Blog
Wave times
  • About
  • Elliott Waves
    • Elliott Waves Explained
    • Elliott Wave Magic Illustrated with Wave Charts
    • Elliott Wave Edge – How Elliott Wave Traders Win
    • Fibonacci Number Series and Elliott Waves
    • How to use Fibonacci Ratio Retracements
    • Elliott Wave Books
      • The Elliott Wave Book – Five Waves to Financial Freedom
      • Dividend Growth Investing Using Elliott Waves
    • Videos
  • Equities
    • Indices
      • Africa
        • Egypt
      • Australia
      • European Indices
        • AEX – Index, Amsterdam
        • DAX Index
        • Istanbul
        • Russia
        • Spain’s IBEX 35
      • Asian Indices
        • India
        • China
        • Dubai
        • Kuwait
        • Kuala Lumpur
        • Pakistan
        • Saudi
        • Taiwan
      • US Indices
        • S&P500
        • Nasdaq
        • Dow Jones
        • Dow Jones Utilities
    • Stocks
      • Asian Stocks
        • Indian Stocks Trading
        • Dubai Stocks Outlook
        • Japanese Stocks
        • Kuwait stocks
        • Saudi Stocks Outlook
      • African Stocks
        • Egyptian Stocks
      • Swiss Stocks
      • Australian Stocks
      • European Stocks
      • US Stocks outlook
      • UK Stocks
  • Commodities
    • Copper
    • Gasoline
    • Gold
    • Natural Gas
    • Oil
    • Palm Oil
    • Raw Sugar
    • Rubber
    • Soybean Oil
    • Silver
  • Forex
    • AUD
    • Bitcoin
    • CAD
    • CHF
    • Euro
    • GBP
    • INR
    • NZD
    • JPY
  • Raves
  • Consulting
    • Consulting
  • Ramki’s Watchlist
WaveTimes Blog WaveTimes Blog
Home » Elliott Wave update on German Dax index
DAX Index

Elliott Wave update on German Dax index

RamkiBy RamkiMarch 29, 201215 Comments2 Mins Read
Facebook Twitter LinkedIn Telegram Pinterest Tumblr Reddit WhatsApp Email
Share
Facebook Twitter LinkedIn Pinterest Email

Back in Dec 2011, I posted my Dax index outlook using Elliott Wave analysis, more with an intention to teach how we could apply the Elliott wave Principle than to forecast. I proposed a bearish count, but the index recovered more than anticpated. Now is a good time to review the movements from the low posted in September 2011.
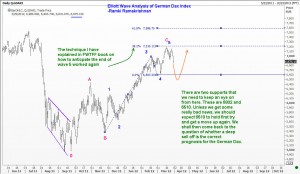
I am continuing to label the first rally up as wave A for now. Remember that all Elliott Wave labels are work in progress. We will make changes as the market unfolds. The idea is to give ourselves an edge, a system, that will tell us we are wrong much sooner than otherwise. Observe from the chart that we have likely finished a 5 wave rally from the (potential) wave B bottom. If this 5 wave rally is a C wave (and not a 3rd wave) we will eventually get an overlap on the top of wave A to confirm a bearish count. However, I tend to be careful at these levels.

There are two supports that we need to keep an eye on from here. These are 6802 and 6510. Unless we get some really bad news, we should expect 6510 to hold first try and get a move up again. We shall then come back to the question of whether a deep sell off is the correct prognosis for the German Dax.

Dax German Stock Index
Share. Facebook Twitter Pinterest LinkedIn Tumblr Telegram Email
Previous ArticleNatural Gas Hits 10-Year Lows – And It's Still Not Time To Buy
Next Article Prepare for the unexpected in EUR/USD
Ramki
  • Website

Related Posts

Elliott Wave Analysis of German DAX (DE30) Index post Brexit

June 25, 2016

Elliott Wave update on German Dax Index: Aug 2012

August 6, 2012

DAX Index outlook Dec 2011 using Elliott Wave Analysis

December 19, 2011
View 15 Comments

15 Comments

  1. Antonio on March 30, 2012 12:51 pm

    Hi Mr Ramki,
    So if we now think wave 5-C was 3, and wave 4 is under development, did you determine these two supports with the fibonacci ratios of new wave three as you explain in your book? 6802 is near my calculations, but the second one, 6510 is not so close, may be I did something wrong…
    Thank you for all your help!
    Antonio

    Reply
  2. Rohit on March 30, 2012 10:52 pm

    So many European/US markets show this count and some at key retracements, that the trade for the downside would be an interesting one when it confirms. But like you said we have seen patterns become much more complex before they play out at times and that needs watching.

    Reply
  3. Dave on April 9, 2012 6:01 pm

    labeled wrong. 5 waves up to A is 1, then 3 waves to b is really 2… then 5 waves to recent highs is 3, now we are in 4…. 5 will come after 4

    Reply
    • Ramki on April 9, 2012 10:09 pm

      Hello Dave, Thanks for your comments. You could be right. My approach to EWP is to keep an open mind about the future. We are not trying to be right in the count as much as we are attempting to be right about calling the direction of the next move. This is the philosophy I have emphasized in my book as well. That way, no one needs to be scared of counting teh waves wrong. What they need to be comfortable is whether they would “know” when they will be proved wrong. As many others will be reading these comments, I think the short term supports have moved slightly higher, perhaps to around 6565/85 from where we should get another recovery. If we go higher first, then look for 6880 levels to resist. So any longs should be exited there if we recover directly to 6880, and look for the dip to 6565/85. Good luck!

      Reply
      • Jeromy on April 16, 2012 9:44 am

        any updates? still the 7000 in focus?

        Reply
        • Ramki on April 16, 2012 9:52 pm

          HI Jeromy, We have come close to the 6510 support discussed last time. I think the index will range trade for some time, between 6730 and 6500. During this time, it is best not to have a firm view. If we trade below the top of Wave A at 6430 area, then the going will be a lot easier and we can firm up a trading plan.

          Reply
          • jeromy on April 17, 2012 11:13 am

            nice…

            Do you think the wave for 7000 is coming now and followed by wave towards 6800, following the 7800 or 8000?

          • Ramki on April 21, 2012 10:02 pm

            Hi Jeromy, The index found support at 6548, a shade higher than the 6510 I had in mind. It still looks weak on the daily charts, so maybe we will range trade for a few days. We will discuss the next steps after this correction is resolved.

  4. prithvi on April 19, 2012 6:23 am

    Ramki,

    Is there NSEi 5th wave on daily basis must comes near 5609 or may be trade higher,
    Or its may be failed to move 5380-5400.
    4th finished at 5135 and 5th fail to move higher and NSEI comes down ?
    is it will happened that 5th wave can not complete the top of 3rd wave and come down.

    just for my knowledge.

    Reply
    • Ramki on April 21, 2012 9:55 pm

      Hi Prithvi, As the NSEI is in a complex correction, it is hard to say at this point what is going to happen next. When I have additional clues, I will post on WaveTimes.

      Reply
  5. Peter on May 4, 2012 1:24 pm

    Hi Ramki, firstly thank you for your blog and your work! Secondly I would like to ask you if you could do an update on DAX and/or SPX 500. After todays price action (4th Mai) it would be nice to have your view.
    I thank you very much!
    Peter

    Reply
    • Ramki on May 6, 2012 1:26 am

      Hi Peter, We experienced a nice recovery already from just below the 6510 level in the DAX. As you know, we have the French Presidential election results in the way, and the market’s reaction to that will determine the immediate outlook. A close below 6430 in the German Dax will confirm a top is already in place. Until that happens, we should stick with the original view! By the way, I have also done some analysis of UBS traded in the Swiss excahnge (in addition to the NYSE version already posted). If you can tell me that there are a lot of readers in Switzerland who might be interetsed, I will post that too.

      Reply
  6. Jeromy on May 7, 2012 6:02 am

    What you’re thinking about my shorttime update. last screenshot, for zooming use onclick on screenshot:

    http://twitter.com/#!/additjournial/status/199483695856488450

    Reply
    • Ramki on May 7, 2012 8:03 pm

      Hi Jeromy, thanks for sharing. I suggest you stick to one count and work on that till proved wrong. Good luck

      Reply
  7. Jeromy on May 16, 2012 1:11 am

    Not sticking, but trading. I seek the lower risk, not the high level counts. Actually my turns are about 14 days until my limits/stops are filled. Like today.

    Reply

Leave A Reply Cancel Reply

Recent Posts
  • Has Meta (Facebook) stock seen the bottom
  • What Is The Nearest Technical Support For Meta (NASDAQ: FB)
  • Using Elliott Waves to Capture a Trade in S&P500
  • Hedge Funds and Elliott Waves – Netflix $NFLX
  • When Elliott Waves applauds the promoter’s signals!

WaveTimes is a Research Organization dedicated to providing original analysis, reports, reviews, and insights on developments in mutual funds, stocks, investing, foreign exchange, commodities, and bonds.

Contact WaveTimes

L-601 Mantri Espana,

Kariyammana Agrahara, Bellandur, Bangalore 560103

Follow Us

  • Facebook
  • YouTube
  • Twitter

© 2023 Wave Times. All Rights Reserved.
  • About
  • Books
  • Privacy Policy
  • Policies and Standards

Type above and press Enter to search. Press Esc to cancel.