• About
  • Elliott Waves
    • Elliott Waves Explained
    • Elliott Wave Magic Illustrated with Wave Charts
    • Elliott Wave Edge – How Elliott Wave Traders Win
    • Fibonacci Number Series and Elliott Waves
    • How to use Fibonacci Ratio Retracements
    • Elliott Wave Books
      • The Elliott Wave Book – Five Waves to Financial Freedom
      • Dividend Growth Investing Using Elliott Waves
    • Videos
  • Equities
    • Indices
      • Africa
        • Egypt
      • Australia
      • European Indices
        • AEX – Index, Amsterdam
        • DAX Index
        • Istanbul
        • Russia
        • Spain’s IBEX 35
      • Asian Indices
        • India
        • China
        • Dubai
        • Kuwait
        • Kuala Lumpur
        • Pakistan
        • Saudi
        • Taiwan
      • US Indices
        • S&P500
        • Nasdaq
        • Dow Jones
        • Dow Jones Utilities
    • Stocks
      • Asian Stocks
        • Indian Stocks Trading
        • Dubai Stocks Outlook
        • Japanese Stocks
        • Kuwait stocks
        • Saudi Stocks Outlook
      • African Stocks
        • Egyptian Stocks
      • Swiss Stocks
      • Australian Stocks
      • European Stocks
      • US Stocks outlook
      • UK Stocks
  • Commodities
    • Copper
    • Gasoline
    • Gold
    • Natural Gas
    • Oil
    • Palm Oil
    • Raw Sugar
    • Rubber
    • Soybean Oil
    • Silver
  • Forex
    • AUD
    • Bitcoin
    • CAD
    • CHF
    • Euro
    • GBP
    • INR
    • NZD
    • JPY
  • Raves
  • Consulting
    • Consulting
  • Ramki’s Watchlist
Top News

Has Meta (Facebook) stock seen the bottom

March 21, 2022

What Is The Nearest Technical Support For Meta (NASDAQ: FB)

February 7, 2022

Using Elliott Waves to Capture a Trade in S&P500

January 27, 2022
Facebook Twitter Instagram
WaveTimes Blog WaveTimes Blog
Wave times
  • About
  • Elliott Waves
    • Elliott Waves Explained
    • Elliott Wave Magic Illustrated with Wave Charts
    • Elliott Wave Edge – How Elliott Wave Traders Win
    • Fibonacci Number Series and Elliott Waves
    • How to use Fibonacci Ratio Retracements
    • Elliott Wave Books
      • The Elliott Wave Book – Five Waves to Financial Freedom
      • Dividend Growth Investing Using Elliott Waves
    • Videos
  • Equities
    • Indices
      • Africa
        • Egypt
      • Australia
      • European Indices
        • AEX – Index, Amsterdam
        • DAX Index
        • Istanbul
        • Russia
        • Spain’s IBEX 35
      • Asian Indices
        • India
        • China
        • Dubai
        • Kuwait
        • Kuala Lumpur
        • Pakistan
        • Saudi
        • Taiwan
      • US Indices
        • S&P500
        • Nasdaq
        • Dow Jones
        • Dow Jones Utilities
    • Stocks
      • Asian Stocks
        • Indian Stocks Trading
        • Dubai Stocks Outlook
        • Japanese Stocks
        • Kuwait stocks
        • Saudi Stocks Outlook
      • African Stocks
        • Egyptian Stocks
      • Swiss Stocks
      • Australian Stocks
      • European Stocks
      • US Stocks outlook
      • UK Stocks
  • Commodities
    • Copper
    • Gasoline
    • Gold
    • Natural Gas
    • Oil
    • Palm Oil
    • Raw Sugar
    • Rubber
    • Soybean Oil
    • Silver
  • Forex
    • AUD
    • Bitcoin
    • CAD
    • CHF
    • Euro
    • GBP
    • INR
    • NZD
    • JPY
  • Raves
  • Consulting
    • Consulting
  • Ramki’s Watchlist
WaveTimes Blog WaveTimes Blog
Home » DAX Index outlook Dec 2011 using Elliott Wave Analysis
DAX Index

DAX Index outlook Dec 2011 using Elliott Wave Analysis

RamkiBy RamkiDecember 19, 201120 Comments2 Mins Read
Facebook Twitter LinkedIn Telegram Pinterest Tumblr Reddit WhatsApp Email
Share
Facebook Twitter LinkedIn Pinterest Email

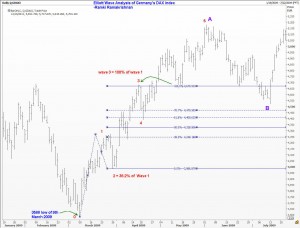
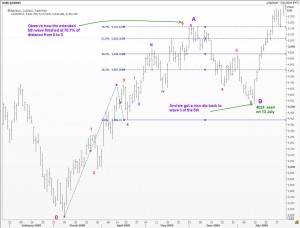
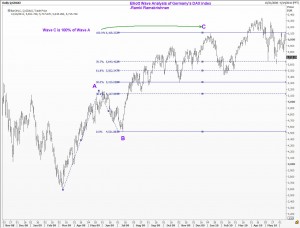
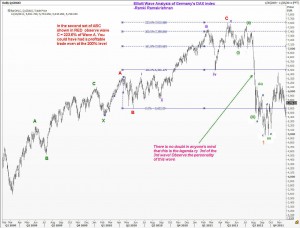
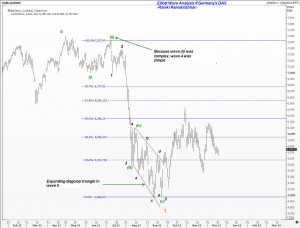
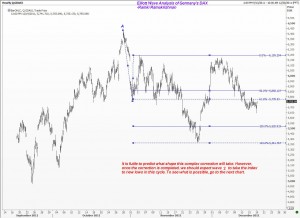
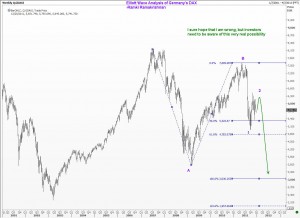
How bad can it get for the European stocks during this ongoing crisis? In particular, can Germany’s DAX index weather the storm? When one thinks back at how nicely the US stock markets performed during the last couple of years, I am probably going to be frightfully wrong with this analysis. Yet, you should be aware of how bad it can get if things go the way I have shown here.All I have done is to use my knowledge of the Wave Principle, and come up with one scenario. This scenario respects all the rules and guidelines that needs to be followed while using Elliott Wave Principle. However, the picture could change as we go forward, and hence you should be aware that this doomsday scenario is currently mostly academic. (Guess I have given sufficient room to escape your wrath if the index goes straight up!!)

Anyway, I have also illustrated how you could count the waves from the significant low posted by the DAX index in March 2009. At the very least you would have gained some insight at how the waves tie in with each other. Look at the charts in the same order as posted.
Happy New Year folks!

DAX Index German Index Ramki
Share. Facebook Twitter Pinterest LinkedIn Tumblr Telegram Email
Previous ArticleS&P500 Elliott Wave Outlook Dec 2011
Next Article Happy New Year
Ramki
  • Website

Related Posts

Elliott Wave Analysis of German DAX (DE30) Index post Brexit

June 25, 2016

Trading NIFTY using Elliott Waves by Ramki of Wavetimes.com

October 23, 2013

Elliott Wave update on German Dax Index: Aug 2012

August 6, 2012
View 20 Comments

20 Comments

  1. Srinivasan on December 19, 2011 4:56 am

    Mr. Ramki,

    Very interesting to see your analysis of SPX and DAX. You have the SPX as an impulsive 5 wave move from 2009 followed by a correction in progress, while DAX as a corrective move from 2009 followed by start of an impulsive 1-2 move down in progress. See attached chart http://i.imgur.com/TuRfs.png . Both indices are very highly correlated since 2008. How come two different views?

    Srinivasan.

    Reply
    • Ramki on December 19, 2011 5:19 am

      Hello Srini, As you know I am more concerned with getting the major direction correct.Then it becomes easy to trade the smaller waves.We should give ourselves the flexibility to change our counts.After all, we are doing all this to help ourselves, and not to show others we can do Elliott Wave analysis properly (and to get some paid subscriptions, or clicks on some Google ads on the website!!)

      Reply
      • Srinivasan on December 19, 2011 8:35 am

        Thank you for your response. I’m trying to learn from your wisdom. I’ve been successful in convincing my wife that we should move to cash in our retirement portfolio. Make a decision when S&P nears 1000 to decide if we want to go long again or wait longer for the dooms day scenario as indicated in the DAX chart.

        Regards,
        -Srinivasan.

        Reply
        • Ramki on December 20, 2011 3:04 am

          Hi Srini, it’s my pleasure to connect. Best of luck with your plans

          Reply
  2. Sriman on December 19, 2011 7:53 am

    Ramki,

    Let me ask you this, did you see any thing in dax which you don’t see in s&p500, or the dax count could be an alternative count for s&p 500 as well?

    Sriman

    Reply
  3. Sriman on December 19, 2011 7:58 am

    Ramki,

    Let me ask you this, did you see any thing in dax which you don’t see in s&p500, or the dax count could be an alternative count for s&p 500 as well?

    it’s not just spx and dax, but lot of world indexs are correlated some are more and some are less. Just wondering to figure out what the nifty is going to do?

    I appreciate your posts and comments and I find your book is very educational to every one, who wants to participate in stock market.

    Sriman

    Reply
    • Ramki on December 20, 2011 2:55 am

      Hi Sriman, tks for your comments. I’ m looking at the two indices separately. Overall, in the big pic I sm bearish for the SNP as well.

      Reply
  4. Dinesh Kumar Bohre on December 20, 2011 3:45 am

    Dear Sir,

    I enjoyed the detailed charts, I could question myself on the charts and found answers in comments of the charts.

    Thanks

    Reply
  5. Stani on December 20, 2011 10:50 am

    Hello Ramki,
    if we look at min&max prices wave iv comes to price zone of wave i in wave 5. Does this brake Elliot rules or should we consider always close prices?
    Thank You for your great work!
    With best regards,
    Stani

    Reply
    • Ramki on December 21, 2011 3:24 am

      Hi Stani, Overlaps are allowed in a diagonal triangle which often appear in fifth wave position

      Reply
  6. waquar on December 20, 2011 12:04 pm

    (Guess I have given sufficient room to escape your wrath if the index goes straight up!!) xDD 🙂
    Nobody could have explained the analysis better ramki ji.
    Happy new year to you too.

    Waquar.

    Reply
  7. Pingback: DAX Index outlook Dec 2011 using Elliott Wave Analysis | Trade … | World Finance

  8. shafaat on December 23, 2011 4:03 pm

    sir ur Elliott Wave Analysis is great… thanks alot………

    shafaat……….

    Reply
  9. riddhi on January 26, 2012 4:51 am

    Sir DAX moving well above 6500. Any change in view ?

    Reply
    • Ramki on January 31, 2012 10:29 pm

      Hi Riddhi, The discussion on Dax earlier was a doomsday scenario, and I thought i made it quite clear that it was still a changing picture. Anyway, if we get a move below 6160 now, that is a confirmation that we will go a good way lower. Best.

      Reply
  10. d.s.s on March 29, 2012 10:16 am

    Hi amazing and educational blog which i have been reading from near inception, but for the first time i commenting!
    Sir now the dax has far exceeded your expectations do you still expect a significant correction, a small correction has already started with the dax falling from 7200 level to just today below 6900 is this in your opinion a sign of things to come?
    I feel we may have a sizeable correction coming on the s&p to the 1100 level which is inline with your thoughts this would equate to circa 5500 dax??
    Once again thanks for a great blog and all your work, much appreciated

    Reply
    • Ramki on March 29, 2012 11:40 pm

      Hello D.S.S, I have posted on DAX today. Good luck.

      Reply
  11. Dimitrios Charalampidis on May 7, 2012 4:54 pm

    Hi Ramki,
    I’m new to your blog, so first I would like to thank you for sharing your work.
    I’m experiencing difficulties to understand your labeling; could you please assist me with this?
    For example at a chart above (http://www.wavetimes.com/wp-content/uploads/2011/12/Dax-d-19-Dec-2011.jpg) you use a green ABCX formation, then a red ABC follows… and finally an orange 1???
    I am certainly not an expert at EWP, but still…
    Thank you very much in advance, D.

    Reply
    • Ramki on May 7, 2012 7:53 pm

      Hi Dimitrious, welcome to the club. If you are new to Elliott waves it might be a good idea to first read a good book about it. A lot of people think that “Five waves to financial freedom” is a good starting point. About my own counts, the orange wave 1 that came after the second ABC could actually be wave A, but my approach to counting is to be practical and not academic. I am flexible about changing the label to “a” later on. Hope this clarifies.

      Reply
  12. Lothar Hufner on July 31, 2012 1:43 am

    Hi Ramki,

    been following your posts with interest, thank you for sharing your knowledge,
    now we are 7 month into 2012,
    have you chanched your count on the DAX or do you still come up more or less with the same conclusion? would be nice if you could give us another updated chart.

    Reply

Leave A Reply Cancel Reply

Recent Posts
  • Has Meta (Facebook) stock seen the bottom
  • What Is The Nearest Technical Support For Meta (NASDAQ: FB)
  • Using Elliott Waves to Capture a Trade in S&P500
  • Hedge Funds and Elliott Waves – Netflix $NFLX
  • When Elliott Waves applauds the promoter’s signals!

WaveTimes is a Research Organization dedicated to providing original analysis, reports, reviews, and insights on developments in mutual funds, stocks, investing, foreign exchange, commodities, and bonds.

Contact WaveTimes

L-601 Mantri Espana,

Kariyammana Agrahara, Bellandur, Bangalore 560103

Follow Us

  • Facebook
  • YouTube
  • Twitter

© 2022 Wave Times. All Rights Reserved.
  • About
  • Books
  • Privacy Policy
  • Policies and Standards

Type above and press Enter to search. Press Esc to cancel.