• About
  • Elliott Waves
    • Elliott Waves Explained
    • Elliott Wave Magic Illustrated with Wave Charts
    • Elliott Wave Edge – How Elliott Wave Traders Win
    • Fibonacci Number Series and Elliott Waves
    • How to use Fibonacci Ratio Retracements
    • Elliott Wave Books
      • The Elliott Wave Book – Five Waves to Financial Freedom
      • Dividend Growth Investing Using Elliott Waves
    • Videos
  • Equities
    • Indices
      • Africa
        • Egypt
      • Australia
      • European Indices
        • AEX – Index, Amsterdam
        • DAX Index
        • Istanbul
        • Russia
        • Spain’s IBEX 35
      • Asian Indices
        • India
        • China
        • Dubai
        • Kuwait
        • Kuala Lumpur
        • Pakistan
        • Saudi
        • Taiwan
      • US Indices
        • S&P500
        • Nasdaq
        • Dow Jones
        • Dow Jones Utilities
    • Stocks
      • Asian Stocks
        • Indian Stocks Trading
        • Dubai Stocks Outlook
        • Japanese Stocks
        • Kuwait stocks
        • Saudi Stocks Outlook
      • African Stocks
        • Egyptian Stocks
      • Swiss Stocks
      • Australian Stocks
      • European Stocks
      • US Stocks outlook
      • UK Stocks
  • Commodities
    • Copper
    • Gasoline
    • Gold
    • Natural Gas
    • Oil
    • Palm Oil
    • Raw Sugar
    • Rubber
    • Soybean Oil
    • Silver
  • Forex
    • AUD
    • Bitcoin
    • CAD
    • CHF
    • Euro
    • GBP
    • INR
    • NZD
    • JPY
  • Raves
  • Consulting
    • Consulting
  • Ramki’s Watchlist
Top News

Has Meta (Facebook) stock seen the bottom

March 21, 2022

What Is The Nearest Technical Support For Meta (NASDAQ: FB)

February 7, 2022

Using Elliott Waves to Capture a Trade in S&P500

January 27, 2022
Facebook Twitter Instagram
WaveTimes Blog WaveTimes Blog
Wave times
  • About
  • Elliott Waves
    • Elliott Waves Explained
    • Elliott Wave Magic Illustrated with Wave Charts
    • Elliott Wave Edge – How Elliott Wave Traders Win
    • Fibonacci Number Series and Elliott Waves
    • How to use Fibonacci Ratio Retracements
    • Elliott Wave Books
      • The Elliott Wave Book – Five Waves to Financial Freedom
      • Dividend Growth Investing Using Elliott Waves
    • Videos
  • Equities
    • Indices
      • Africa
        • Egypt
      • Australia
      • European Indices
        • AEX – Index, Amsterdam
        • DAX Index
        • Istanbul
        • Russia
        • Spain’s IBEX 35
      • Asian Indices
        • India
        • China
        • Dubai
        • Kuwait
        • Kuala Lumpur
        • Pakistan
        • Saudi
        • Taiwan
      • US Indices
        • S&P500
        • Nasdaq
        • Dow Jones
        • Dow Jones Utilities
    • Stocks
      • Asian Stocks
        • Indian Stocks Trading
        • Dubai Stocks Outlook
        • Japanese Stocks
        • Kuwait stocks
        • Saudi Stocks Outlook
      • African Stocks
        • Egyptian Stocks
      • Swiss Stocks
      • Australian Stocks
      • European Stocks
      • US Stocks outlook
      • UK Stocks
  • Commodities
    • Copper
    • Gasoline
    • Gold
    • Natural Gas
    • Oil
    • Palm Oil
    • Raw Sugar
    • Rubber
    • Soybean Oil
    • Silver
  • Forex
    • AUD
    • Bitcoin
    • CAD
    • CHF
    • Euro
    • GBP
    • INR
    • NZD
    • JPY
  • Raves
  • Consulting
    • Consulting
  • Ramki’s Watchlist
WaveTimes Blog WaveTimes Blog
Home » Elliott Wave update for Alliant Energy Corporation
US Stocks outlook

Elliott Wave update for Alliant Energy Corporation

RamkiBy RamkiJuly 3, 20144 Comments1 Min Read
Facebook Twitter LinkedIn Telegram Pinterest Tumblr Reddit WhatsApp Email
Share
Facebook Twitter LinkedIn Pinterest Email

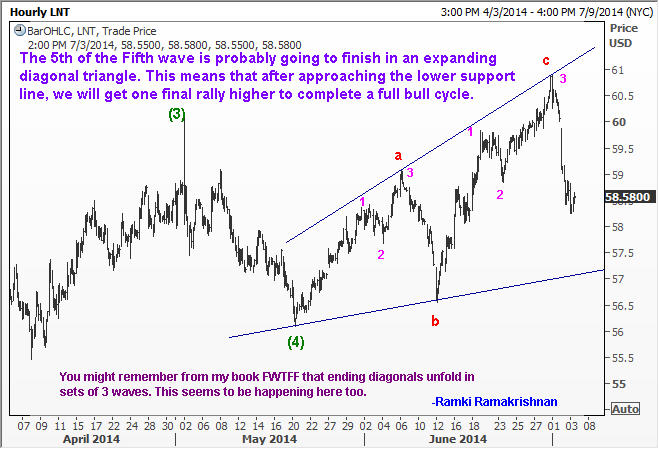
This Elliott Wave update on Alliant Energy Corporation is a sequel to the detailed analysis posted on 1st June 2014 in Wavetimes.com. Here is the link for that post: https://wavetimes.com/elliott-wave-analysis-of-alliant-energy-corporation-nyse-lnt/
For your convenience, I have also appended this new chart at the bottom of the older post as well. As most of you know, this blog is dedicated to all the traders and investors who seek to improve their financial market performance. I would like to call this a “Living Book”, an extension of Five Waves to Financial Freedom.

(Some of you might be interested to check out the other website, wavetimes.net which caters to professionals who have significant money at risk)

Elliott Wave Ending Diagonal

Elliott Wave Cycle Explained

alliant energy Elliott Wave ending diagonal
Share. Facebook Twitter Pinterest LinkedIn Tumblr Telegram Email
Previous ArticleC.R.Bard Inc has way to go South, says Elliott Waves
Next Article How market clues tie up with Elliott Waves
Ramki
  • Website

Related Posts

Has Meta (Facebook) stock seen the bottom

March 21, 2022

What Is The Nearest Technical Support For Meta (NASDAQ: FB)

February 7, 2022

Hedge Funds and Elliott Waves – Netflix $NFLX

January 17, 2022
View 4 Comments

4 Comments

  1. Kevin Bull on July 7, 2014 7:32 am

    Ending diagonals appear to very reliable once identified, as per the one in eurusd which looks to have completed between Nov 2013 to May 2014, and as per the one finishing (just as of 4th July 2014) in GBPUSD, “possibly”.

    See if the 4th July marks the high in GBPUSD for a potential decline back below the 1.5 region, there is no confirmation yet.

    Reply
    • Ramki Ramakrishnan on July 7, 2014 9:08 pm

      Hi Kevin, You certainly have keen eyes. But I don’t think we are anywhere near completing this diagonal. It is probably a couple of months away, during which we could dip to 1.6980, and just when everyone wakes up to the potential break of the diagonal, we will rally anew to 1.7250. DO me a favor and remind me if we reach 1.7250, by email as well as through these comments (I look at the comments once every few days). Best

      Reply
  2. sandy on July 15, 2014 5:31 pm

    Hi Ramki,
    I have read your book and have following queries.
    1. how one should identify that wave 3 and 4 got over. is there any tool lie RSI, Elliott wave Oscillator by which we can come to know about it.
    2. Is RSI reading is maximum at end of wave 3 always,

    Thanks

    Reply
    • Ramki Ramakrishnan on July 16, 2014 8:33 pm

      Sandy, If wave 1 was of normal proportion, you should not be surprised if wave 3 extends. However, sometimes wave 3 is also normal and wave 5 extends. It is unwise to try and pick the top of wave 3. Instead, look to get on the trend when wave 4 ends. My book explains how to determine the end points of corrections. All the best.

      Reply

Leave A Reply Cancel Reply

Recent Posts
  • Has Meta (Facebook) stock seen the bottom
  • What Is The Nearest Technical Support For Meta (NASDAQ: FB)
  • Using Elliott Waves to Capture a Trade in S&P500
  • Hedge Funds and Elliott Waves – Netflix $NFLX
  • When Elliott Waves applauds the promoter’s signals!

WaveTimes is a Research Organization dedicated to providing original analysis, reports, reviews, and insights on developments in mutual funds, stocks, investing, foreign exchange, commodities, and bonds.

Contact WaveTimes

L-601 Mantri Espana,

Kariyammana Agrahara, Bellandur, Bangalore 560103

Follow Us

  • Facebook
  • YouTube
  • Twitter

© 2023 Wave Times. All Rights Reserved.
  • About
  • Books
  • Privacy Policy
  • Policies and Standards

Type above and press Enter to search. Press Esc to cancel.