• About
  • Elliott Waves
    • Elliott Waves Explained
    • Elliott Wave Magic Illustrated with Wave Charts
    • Elliott Wave Edge – How Elliott Wave Traders Win
    • Fibonacci Number Series and Elliott Waves
    • How to use Fibonacci Ratio Retracements
    • Elliott Wave Books
      • The Elliott Wave Book – Five Waves to Financial Freedom
      • Dividend Growth Investing Using Elliott Waves
    • Videos
  • Equities
    • Indices
      • Africa
        • Egypt
      • Australia
      • European Indices
        • AEX – Index, Amsterdam
        • DAX Index
        • Istanbul
        • Russia
        • Spain’s IBEX 35
      • Asian Indices
        • India
        • China
        • Dubai
        • Kuwait
        • Kuala Lumpur
        • Pakistan
        • Saudi
        • Taiwan
      • US Indices
        • S&P500
        • Nasdaq
        • Dow Jones
        • Dow Jones Utilities
    • Stocks
      • Asian Stocks
        • Indian Stocks Trading
        • Dubai Stocks Outlook
        • Japanese Stocks
        • Kuwait stocks
        • Saudi Stocks Outlook
      • African Stocks
        • Egyptian Stocks
      • Swiss Stocks
      • Australian Stocks
      • European Stocks
      • US Stocks outlook
      • UK Stocks
  • Commodities
    • Copper
    • Gasoline
    • Gold
    • Natural Gas
    • Oil
    • Palm Oil
    • Raw Sugar
    • Rubber
    • Soybean Oil
    • Silver
  • Forex
    • AUD
    • Bitcoin
    • CAD
    • CHF
    • Euro
    • GBP
    • INR
    • NZD
    • JPY
  • Raves
  • Consulting
    • Consulting
  • Ramki’s Watchlist
Top News

Has Meta (Facebook) stock seen the bottom

March 21, 2022

What Is The Nearest Technical Support For Meta (NASDAQ: FB)

February 7, 2022

Using Elliott Waves to Capture a Trade in S&P500

January 27, 2022
Facebook Twitter Instagram
WaveTimes Blog WaveTimes Blog
Wave times
  • About
  • Elliott Waves
    • Elliott Waves Explained
    • Elliott Wave Magic Illustrated with Wave Charts
    • Elliott Wave Edge – How Elliott Wave Traders Win
    • Fibonacci Number Series and Elliott Waves
    • How to use Fibonacci Ratio Retracements
    • Elliott Wave Books
      • The Elliott Wave Book – Five Waves to Financial Freedom
      • Dividend Growth Investing Using Elliott Waves
    • Videos
  • Equities
    • Indices
      • Africa
        • Egypt
      • Australia
      • European Indices
        • AEX – Index, Amsterdam
        • DAX Index
        • Istanbul
        • Russia
        • Spain’s IBEX 35
      • Asian Indices
        • India
        • China
        • Dubai
        • Kuwait
        • Kuala Lumpur
        • Pakistan
        • Saudi
        • Taiwan
      • US Indices
        • S&P500
        • Nasdaq
        • Dow Jones
        • Dow Jones Utilities
    • Stocks
      • Asian Stocks
        • Indian Stocks Trading
        • Dubai Stocks Outlook
        • Japanese Stocks
        • Kuwait stocks
        • Saudi Stocks Outlook
      • African Stocks
        • Egyptian Stocks
      • Swiss Stocks
      • Australian Stocks
      • European Stocks
      • US Stocks outlook
      • UK Stocks
  • Commodities
    • Copper
    • Gasoline
    • Gold
    • Natural Gas
    • Oil
    • Palm Oil
    • Raw Sugar
    • Rubber
    • Soybean Oil
    • Silver
  • Forex
    • AUD
    • Bitcoin
    • CAD
    • CHF
    • Euro
    • GBP
    • INR
    • NZD
    • JPY
  • Raves
  • Consulting
    • Consulting
  • Ramki’s Watchlist
WaveTimes Blog WaveTimes Blog
Home » Elliott Wave Analysis of Alliant Energy Corporation (NYSE: LNT)
US Stocks outlook

Elliott Wave Analysis of Alliant Energy Corporation (NYSE: LNT)

RamkiBy RamkiJune 1, 201420 Comments3 Mins Read
Facebook Twitter LinkedIn Telegram Pinterest Tumblr Reddit WhatsApp Email
Share
Facebook Twitter LinkedIn Pinterest Email

Alliant Energy Corporation (NYSE: LNT) has been part of David Van Knapp’s Dividend Growth Portfolio since 2010. In his article in Seeking Alpha, David celebrates the 6th birthday of his portfolio and showcases the stocks that go into that portfolio. The first stock in the list of 18 stocks is Alliant Energy Corporation.

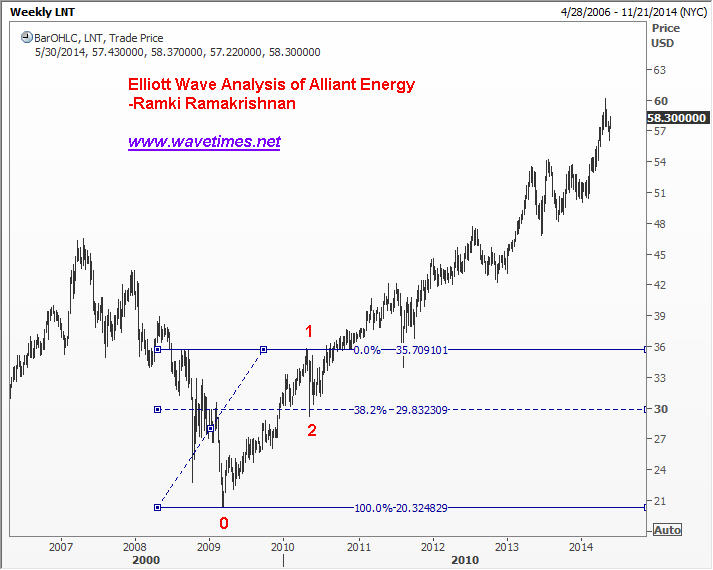
As most of you know, I look at stocks from an Elliott Wave perspective first, and so decided to do a detailed study of Alliant Energy Corporation. Elliott Wave analysis is a method that many professional investors embrace because it gives them several clues about where in the market’s progression we currently are. Briefly, Elliott Wave Analysis says that all impulse waves are made of 5 waves, and once a five wave movement is completed we should expect a correction.

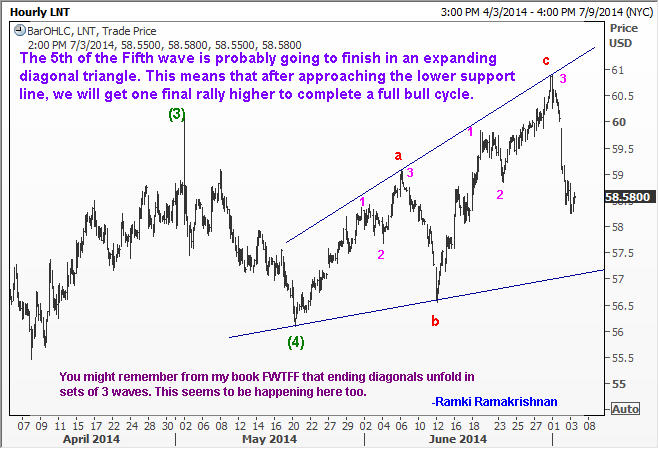
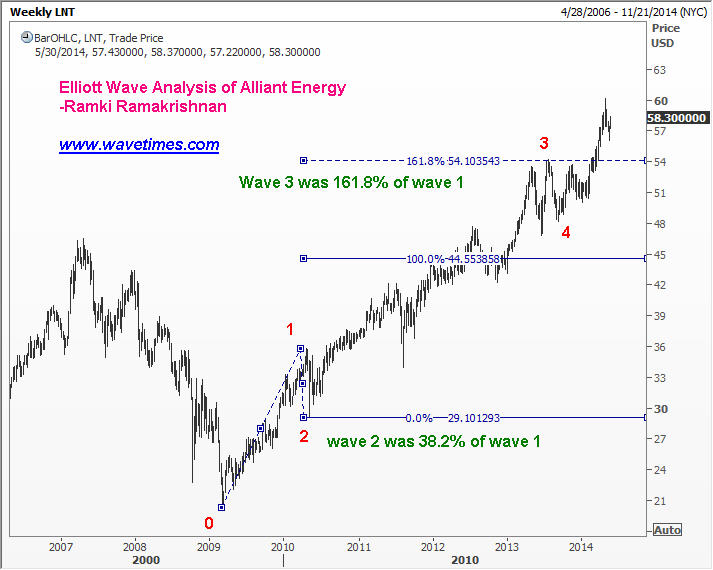
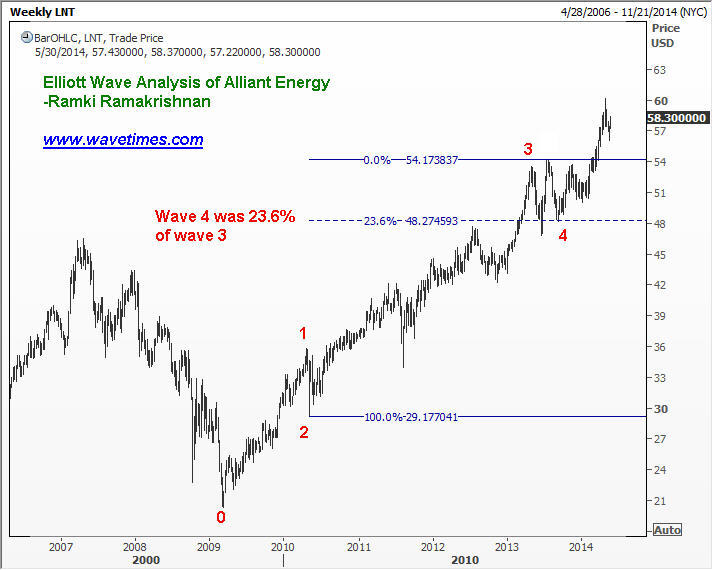
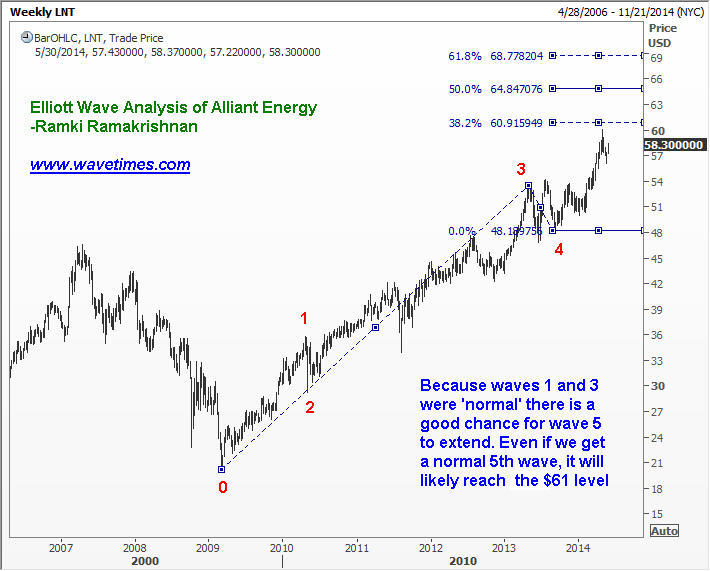
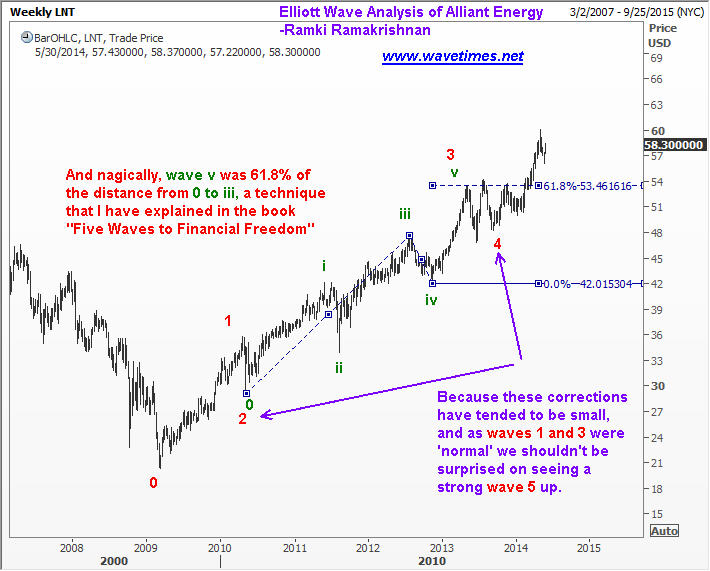
Alliant Energy Corporation’s Elliott Wave charts reveal that we are in the fifth major wave higher, and within that fifth wave, we could potentially be in the fifth sub-wave. Usually, investors should start planning on a strategy to exit their holdings during this fifth-of-the-fifth wave. However, with Alliant Energy Corp the story is slightly different. The first and third waves that we have seen so far were both of normal proportions. Besides, the two corrections in wave 2 and wave 4 positions were both relatively brief. This leads one to anticipate an extended wave 5. So, we might as well be patient and wait for a move to around 60.50 before we take a fresh look at this stock. What follows are a set of 11 Elliott Wave charts of Alliant Energy. Study them carefully to see how the market seems to dance to the magic wand of Elliott Waves. Good luck. (I suggest you right click on each image and open in a new tab)

Alliant Energy Corporation -chart 1
Alliant Energy Corporation -chart 2
Alliant Energy Corporation -chart 3
Alliant Energy Corporation -chart 4
Alliant Energy Corporation -chart 5
Alliant Energy Corporation -chart 6
Alliant Energy Corporation -chart 7
Alliant Energy Corporation -chart 8
Alliant Energy Corporation -chart 9
Alliant Energy Corporation -chart 10
Alliant Energy Corporation -chart 11

Date: 3 July 2014 Elliott Wave update for Alliant Energy Corporation
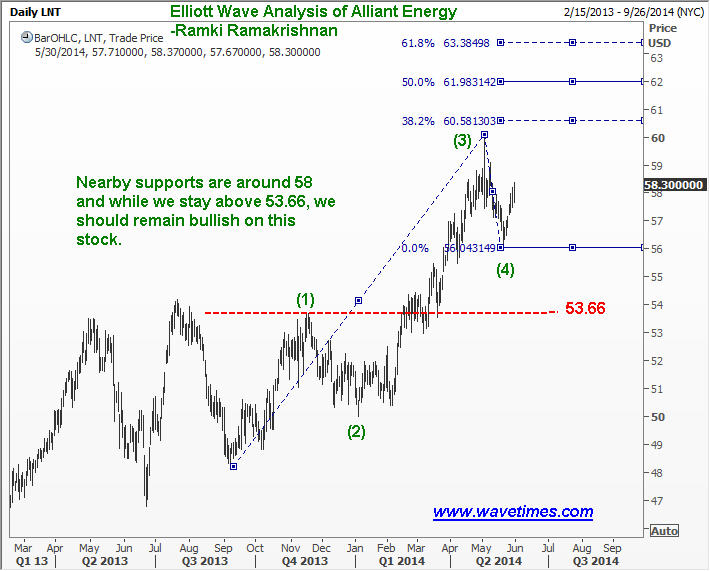
On 1st July, Alliant Energy Corp reached a high of 60.89 and today, just 2 days later, it is down at 58.25. WHat new clues are available? Take a look at this chart.

Elliott Wave update for Alliant Energy

Dividend Growth Elliott Wave Analysis LNT
Share. Facebook Twitter Pinterest LinkedIn Tumblr Telegram Email
Previous ArticleElliott Wave Analysis of Wockhardt Ltd
Next Article Elliott Wave Analysis of Arabtec Holding Co Dubai
Ramki
  • Website

Related Posts

Has Meta (Facebook) stock seen the bottom

March 21, 2022

What Is The Nearest Technical Support For Meta (NASDAQ: FB)

February 7, 2022

Hedge Funds and Elliott Waves – Netflix $NFLX

January 17, 2022
View 20 Comments

20 Comments

  1. Mahesh on June 1, 2014 9:43 pm

    Very useful and educational. Thanks Ramki.

    Reply
  2. kacraj on June 2, 2014 2:52 am

    Dear Ramki Sir,
    Thanks for this great analysis from where I have got lot of insights.
    I have doubt in Alliant Energy Corporation -chart 9.
    Wave 4 Correction. I could see ABC correction, and I am aware that Wave C is impulse and will have 5 waves. My doubt is what about Wave A. Is it impulse wave or it is a corrective wave. Will it have abc wave count or 1-5 wave count. Please help me sir, I have this doubt for a long time.

    kacraj.

    Reply
    • Ramki Ramakrishnan on June 2, 2014 6:23 am

      Hi KacRaj, That is a good question. If we count a correction as a FLAT correction, wave A has to be in 3 waves. If you count wave A as having 5 subwaves, it will be a zigzag or part of a double three. An irregular correction is also a flat correction. You should read FWTFF book again!

      Reply
      • kacraj on June 2, 2014 5:54 pm

        Thank you Sir. I’ve to RE read your book. Have bought the book and have gone thru’ 2 times. I missed this point I think. Thank you very much for spending your valuable time and replying to my query sir.

        Reply
        • Ramki Ramakrishnan on June 11, 2014 8:45 pm

          Kacraj, sometimes I read my own book, lest I forget some point. We all learn all the time as the market is a great teacher.

          Reply
  3. nanda kumar on June 2, 2014 8:22 pm

    sir,
    I feel wave 3 of internal wave 5 is almost end point of wave 5,only time will answer our
    predection,

    Reply
    • Ramki Ramakrishnan on June 11, 2014 8:43 pm

      Nanda Kumar, Never make predictions using Elliott Waves. Make decisions!

      Reply
  4. Joe Hentges on June 3, 2014 12:39 am

    Ramki,
    I enjoyed walking back thru this example very much. My first step was to grab a chart of LNT and see what I would create. I had two main differences that were good learning lessons.

    1) I had Wave 2 on the weekly chart as the first small correction ending in 5/1/09 but that caused me to have i and ii as a large running flat with i at 4/23/10 and ii where your ii is on 8/12/11. Then I realized that B in that running flat would exceed origin of A by well beyond 1.352 so it clearly wasn’t valid.

    2) I thought Wave 4 might actually be a triangle stretching to 1/10/14. But once Wave 2 was clearly identified as sharp zigzag, looking for the Flat for Wave 4, as you identified, made sense.

    Very nice series of charts.
    Thank you. – Joe

    Reply
    • Ramki Ramakrishnan on June 11, 2014 8:42 pm

      JOe, thank you for your comments. Your next big step in learning comes with the realization that your count need not be the same as mine for you to make money! You could make money with your own count provided you remain faithful to it till it proves you wrong. Good luck.

      Reply
  5. Prabh on June 3, 2014 6:06 am

    Ramki Sir,

    In Chart – 8,Wave (iv) in green is overlapping Wave (i).Is that because of chart representation because of limited space or its actual.

    Reply
    • Ramki Ramakrishnan on June 11, 2014 8:40 pm

      Prabh, I dont think there is an overlap there

      Reply
  6. Gem on June 3, 2014 12:07 pm

    Dear Sir,

    I am afraid to trade stocks right now because many analysts say the big crash is coming soon, including the Elliotticians of a popular EW site. They claim it the big cycle correction or something like that. They analyzed ES and S&P500. May I know your opinion about the big crash or may you share a bit of your analysis on ES and S&P500? It has been a long time since the last time you shared your analysis on S&P500 in this site. Thank you in advance.

    Reply
    • Ramki Ramakrishnan on June 11, 2014 8:25 pm

      Gem, The sooner you realize that Elliott Waves are more effective to trade than to make predictions, the better for you. Do your own analysis and you will be just fine! I will post something on S&P when I have something important to share.

      Reply
  7. praveen on June 4, 2014 8:29 am

    Hi Ramki,

    Thanks for providing good example after i read your book.after i read your book with some confident i traded in forex with small amount and make double with in 2 months..i just follow only waves..

    i have small query on chart 5 that 3rd wave within 3rd wave rallied 100% of 0 to 1 wave..you mentioned 3rd wave should rally minimum 161.8% ?

    or else we can consider this as 2 impulse waves are same ?

    please clarify my doubt

    thanks in advance…

    Thnx
    Praveen

    Reply
    • Ramki Ramakrishnan on June 11, 2014 8:01 pm

      Praveen, Congratulations on making some good money on FX with the wave principle. However, you should be ever vigilant in the FX market as there is no room for errors. As for chart 5 in the above post, the 3rd wave can be equal, or less or more than the first wave. The only rule is it should not be the shortest wave, For example, if wave 3 was 76% of wave 1, then wave 5 has to be smaller than 76% of wave 1, ie it has to be shorter still than wave 3. There is no compulsion for wave 3 to be 161.8% of wave 1. I think you are a member of the exclusive club. You may wish to make some comments about your experience there too!

      Reply
  8. Gem on July 1, 2014 4:36 pm

    Dear Mr. Ramki,

    You wrote: “So, we might as well be patient and wait for a move to around 60.50 before we take a fresh look at this stock.”

    Now we are at 60.86, Sir.

    Reply
    • Ramki Ramakrishnan on July 3, 2014 9:11 pm

      Hi Gem, Thank you very much for posting. I don’t even remember what I wrote yesterday! But I will now go back and read that full post and see if the markets have revealed any additional clues. I love readers who care to remember and write. Thanks again.

      Reply
  9. Pingback: Elliott Wave update for Alliant Energy Corporation

  10. sanjeev on April 16, 2017 11:25 am

    hi ramki. is it fixed that at least one of the 5 impulse wave is to be extended, in any time frame , in any chart.
    thanks, good day.

    Reply
    • Ramki Ramakrishnan on April 17, 2017 5:25 am

      Sanjeev, No. That is only a tendency.

      Reply

Leave A Reply Cancel Reply

Recent Posts
  • Has Meta (Facebook) stock seen the bottom
  • What Is The Nearest Technical Support For Meta (NASDAQ: FB)
  • Using Elliott Waves to Capture a Trade in S&P500
  • Hedge Funds and Elliott Waves – Netflix $NFLX
  • When Elliott Waves applauds the promoter’s signals!

WaveTimes is a Research Organization dedicated to providing original analysis, reports, reviews, and insights on developments in mutual funds, stocks, investing, foreign exchange, commodities, and bonds.

Contact WaveTimes

L-601 Mantri Espana,

Kariyammana Agrahara, Bellandur, Bangalore 560103

Follow Us

  • Facebook
  • YouTube
  • Twitter

© 2023 Wave Times. All Rights Reserved.
  • About
  • Books
  • Privacy Policy
  • Policies and Standards

Type above and press Enter to search. Press Esc to cancel.