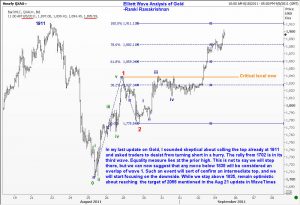
 One of the key reasons why Elliott Wave Analysis scores over other approaches to the market is because you are able to tell with a reasonable degree of confidence ‘where’ we are in the market’s progression. Just as we were able to identify a sizeable decline in Gold from the 1895/1925 window, so also we were able to tell in advance that from near 1695 Gold was likely to stage a recovery. The actual high and low was 1911 and 1702 respectively.
Our major objective for Gold, identified in the August 21 Elliott Wave update, remains 2055. However, knowing that we are mere mortals in front of the market, we should seek additional clues along the way. Elliott has some strict rules, and one of them is in an impulse wave, Wave 3 should not overlap the top of Wave 1. As you can see from the attached chart, we are going up as a third wave, and equality measure for the third wave lies exactly at the prior top of 1911. Should Gold fail there for some unexpected reason, and come back and trade below 1835 (the first wave top), then we will say that the prior top was indeed the end of a major move, and what we just saw was a flat correction that unfolded in 3 waves. The implication is Gold will then travel quickly lower. While we stay above 1835, then, we should continue to be optimistic about the possibility of Gold reaching 2055. We shall, of course, fine tune that target as we go higher.
I suggest that you revise the sections dealing with fifth waves in my book and follow this interesting development as it unfolds. Good luck.

