• About
  • Elliott Waves
    • Elliott Waves Explained
    • Elliott Wave Magic Illustrated with Wave Charts
    • Elliott Wave Edge – How Elliott Wave Traders Win
    • Fibonacci Number Series and Elliott Waves
    • How to use Fibonacci Ratio Retracements
    • Elliott Wave Books
      • The Elliott Wave Book – Five Waves to Financial Freedom
      • Dividend Growth Investing Using Elliott Waves
    • Videos
  • Equities
    • Indices
      • Africa
        • Egypt
      • Australia
      • European Indices
        • AEX – Index, Amsterdam
        • DAX Index
        • Istanbul
        • Russia
        • Spain’s IBEX 35
      • Asian Indices
        • India
        • China
        • Dubai
        • Kuwait
        • Kuala Lumpur
        • Pakistan
        • Saudi
        • Taiwan
      • US Indices
        • S&P500
        • Nasdaq
        • Dow Jones
        • Dow Jones Utilities
    • Stocks
      • Asian Stocks
        • Indian Stocks Trading
        • Dubai Stocks Outlook
        • Japanese Stocks
        • Kuwait stocks
        • Saudi Stocks Outlook
      • African Stocks
        • Egyptian Stocks
      • Swiss Stocks
      • Australian Stocks
      • European Stocks
      • US Stocks outlook
      • UK Stocks
  • Commodities
    • Copper
    • Gasoline
    • Gold
    • Natural Gas
    • Oil
    • Palm Oil
    • Raw Sugar
    • Rubber
    • Soybean Oil
    • Silver
  • Forex
    • AUD
    • Bitcoin
    • CAD
    • CHF
    • Euro
    • GBP
    • INR
    • NZD
    • JPY
  • Raves
  • Consulting
    • Consulting
  • Ramki’s Watchlist
Top News

Has Meta (Facebook) stock seen the bottom

March 21, 2022

What Is The Nearest Technical Support For Meta (NASDAQ: FB)

February 7, 2022

Using Elliott Waves to Capture a Trade in S&P500

January 27, 2022
Facebook Twitter Instagram
WaveTimes Blog WaveTimes Blog
Wave times
  • About
  • Elliott Waves
    • Elliott Waves Explained
    • Elliott Wave Magic Illustrated with Wave Charts
    • Elliott Wave Edge – How Elliott Wave Traders Win
    • Fibonacci Number Series and Elliott Waves
    • How to use Fibonacci Ratio Retracements
    • Elliott Wave Books
      • The Elliott Wave Book – Five Waves to Financial Freedom
      • Dividend Growth Investing Using Elliott Waves
    • Videos
  • Equities
    • Indices
      • Africa
        • Egypt
      • Australia
      • European Indices
        • AEX – Index, Amsterdam
        • DAX Index
        • Istanbul
        • Russia
        • Spain’s IBEX 35
      • Asian Indices
        • India
        • China
        • Dubai
        • Kuwait
        • Kuala Lumpur
        • Pakistan
        • Saudi
        • Taiwan
      • US Indices
        • S&P500
        • Nasdaq
        • Dow Jones
        • Dow Jones Utilities
    • Stocks
      • Asian Stocks
        • Indian Stocks Trading
        • Dubai Stocks Outlook
        • Japanese Stocks
        • Kuwait stocks
        • Saudi Stocks Outlook
      • African Stocks
        • Egyptian Stocks
      • Swiss Stocks
      • Australian Stocks
      • European Stocks
      • US Stocks outlook
      • UK Stocks
  • Commodities
    • Copper
    • Gasoline
    • Gold
    • Natural Gas
    • Oil
    • Palm Oil
    • Raw Sugar
    • Rubber
    • Soybean Oil
    • Silver
  • Forex
    • AUD
    • Bitcoin
    • CAD
    • CHF
    • Euro
    • GBP
    • INR
    • NZD
    • JPY
  • Raves
  • Consulting
    • Consulting
  • Ramki’s Watchlist
WaveTimes Blog WaveTimes Blog
Home » Elliott Wave Analysis of Gold
Gold

Elliott Wave Analysis of Gold

RamkiBy RamkiAugust 21, 201113 Comments2 Mins Read
Facebook Twitter LinkedIn Telegram Pinterest Tumblr Reddit WhatsApp Email
Share
Facebook Twitter LinkedIn Pinterest Email

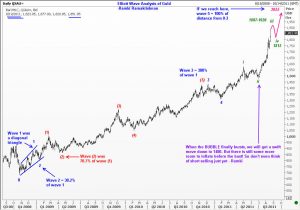
There are many urgent voices asking for an Elliott Wave update on Gold. As you know, I have warned readers here not to be short of this commodity because no matter what your projected targets are for the end of a fifth wave, it could just keep going if it were extending. (This is different from the analysis of GBP/USD presented here today. The fifth wave there is a fifth within a corrective C wave..)

As you can see from the chart, we seem to be experiencing an extension in the fifth wave (even though the third wave was also an extended wave). Although Elliott has said that at least one impulse wave will be extended, we have seen several cases of a trend having two extensions. ( we will not quarrel with those who disagree, because what works for us seems to work well!)
Going back to the Gold chart, wave 3 did a 300% projected move of Wave 1. Then we got a brief correction after which the fifth wave took off to the upside again. There was no way anyone could have predicted a second extension, but WaveTimes warned you that we should forget about being short.

The next question is are we anywhere near the top? My feeling is we will likely experience a bout of selling around 1895/1925 and witness a quick correction down to 1815 area. But then we will try one more time to go up. That final push may well take us to around 2055, but as of now, I would urge you to be very careful during that push. There is nothing as yet in the horizon to make anyone want to dump Gold, but when the bubble does burst (and one possible level lies around 2055), we will get a fairly aggressive move down to 1480. We shall see. Good luck.

Gold
Share. Facebook Twitter Pinterest LinkedIn Tumblr Telegram Email
Previous ArticleMedium Term Outlook for GBP/USD
Next Article Technical Analysis of Gold
Ramki
  • Website

Related Posts

Elliott Wave analysis benefits a short term trader in XAU/USD

June 9, 2017

Elliott Wave Analysis of Gold

April 16, 2013

Elliott Wave Analysis of Gold – September 2012

September 9, 2012
View 13 Comments

13 Comments

  1. Navpreet Singh khattra on August 21, 2011 6:00 am

    Pls. Tell about nifty pridiction

    Reply
  2. bilal khan on August 21, 2011 6:35 am

    Congrats Ramki on recognition from Frobes, they now know what we have all known for so long!!

    When is the book coming so one day perhaps we might get near your level?

    Reply
  3. Nik on August 21, 2011 12:24 pm

    Hi Ramki,

    Thanks for the analysis. After reading about 4-5 posts, I am sure I have become one of your many followers and thus have also subscribed to the posts.

    This is a very interesting to note that you are seeing a burst in Gold as in the trend or the waves in gold prices are cyclical, because gold has been just over (ex-)trending higher and higher and more so acutely; there is no fundamental reason as of now which can substantiate to reason enough for Gold to decline but while there are all good reasons for Gold to only rise amidst all the fear and turmoils of the declines in the stock markets world wide.
    What do you reckon this rise in the Gold prices a more of cyclical change or a structural change? If it were to be a cyclical change, there has to be a major shift in the psychology of the market participants on Gold with creating a (major, likely?) impact on world wide economies.

    If Gold were to decline, standing any major event(irrespective of their nature), what could be the reasons you would cite to coincide with the falling of the prices in Gold? Any early resemblance of such that could be taken as a best bet for shorting.

    My observation with Gold chart is that, we are at the 261.8% of Fibonacci expansion/extension at 1869.28 from the points of connecting
    2006.10.05 : 562.25
    2008.03.17 : 1032.5
    2008.10.24 : 681.42

    which gives the fibo expansion for the level of 261.8% at 1918.69
    note: there could be change in the prices due to usage of different price data feeds but nevertheless I guess that should be able to highlight the parameters I am trying to use to gauge the fibo extensions.
    Thus, we should see some definite correction at these levels initially towards 1650? and then a next leg, as you said, could be up towards the 20xx psychological levels, which market is seemingly gunning for. Then perhaps, could be a downward shift but again, what and why would trigger the gold prices to decline. As such, there is not any reason as of now ….hmmm… unless there is really double dip recession which would increase the vigour in the Dollar buying. Is it?
    It is widely known that the difference between the times of 2008 and today’s market scenario, is the much sought after liquidity. Given the enough liquidity, thanks to QExs, would Gold (or for that matter precious metals?) have any reason to come down to its previous humble levels?
    I am not saying whether gold will further rise or forecasting it will go for a deep dive but trying to understand what could possibly make and trigger Gold go down?
    Any insights?

    Cheers!!

    Reply
    • Ramki on August 22, 2011 1:15 am

      Hello Nick, Thanks for your comments. I am not calling a top as yet, What I have identified is a level where we need to be alert. Even Ralph Elliott has asked practicioners to keep in mind the fundamental events driving the market. Just because a fibonacci projection falls at a particular point does not mandate the market should stop around there. Yet, we have to be aware of these key levels, and be prepared for new cataysts when the price reaches there, just in case! Good luck.

      Reply
  4. Nik on August 22, 2011 5:29 am

    Thanks Ramki.

    I guess length in my comments could have made some of the points to be easily missed. I quote again, here for the sake of posterity and also to know your views.

    What do you reckon this rise in the Gold prices a more of cyclical change or a structural change? If it were to be a cyclical change, there has to be a major shift in the psychology of the market participants on Gold with creating a (major, likely?) impact on world wide economies.

    Reply
  5. ziad on August 23, 2011 3:11 pm

    what a nice call on Gold Ramki , first up to your target then down to your target as well this is BRILLIANT.
    Weldone Ramki…….Keep It Up Good Luck

    Cheers.

    Reply
  6. harsh dixit on August 24, 2011 7:52 am

    sir, now again anything is wrong in 4th wave . why gold fall below 1815 . now again up or go for 1480 from here.

    Reply
  7. Nik on August 24, 2011 10:39 am

    Hi Ramki

    We are seeing gold decline for a consecutive day, almost shedding the 20%(may be almost)gains it made during the past 2 weeks. 🙂

    I could understand the overbought and oversold situations in normal market conditions, but am very much curious to see what fundamentally has triggered the gold decline here from almost 1912 to 1760 (wow, thats a good fall in just 2 days) I am not sure if it has been the biggest single day loss for gold since the days of 2008?
    Appreciate your followup updates on Gold.

    Cheers!

    Reply
  8. bilal khan on August 24, 2011 10:55 pm

    Nik,

    Gold futures margins have been raised is how the MSM will explain it. I prefer the EW version of explaining price action.

    Reply
  9. Nik on August 25, 2011 5:44 am

    Thanks Bilal.

    Reply
  10. Nik on August 30, 2011 3:00 am

    Gold looking to form a potential head & shoulders pattern, and is ranging in the smoke.
    The coming gold festival(s) in India may likely coincide with the gold gunning towads the psycho of 2000s but this technicality of h&s, where does it take forward…waiting for unfolding of the gold charts as time proceeds 🙂

    BTW, Ramki, is there a pdf version of your new book available?

    Reply
    • Ramki on August 30, 2011 3:08 am

      Hello Nik, I am afraid it doesn’t look like a head and shoulders top to me. The book is only available in Kindle format at Amazon and in Nook format at Barnes and Noble. However, you can download teh Kindle for PC application for free from Amazon and enjoy the book. You could also share the book between your other devices such as iPad, iPhone, Blackberry etc

      Reply
  11. Pingback: Elliott Wave Analysis of Gold | Trade with an Edge using Elliott Wave Analysis Wave Times - Ramki

Leave A Reply Cancel Reply

Recent Posts
  • Has Meta (Facebook) stock seen the bottom
  • What Is The Nearest Technical Support For Meta (NASDAQ: FB)
  • Using Elliott Waves to Capture a Trade in S&P500
  • Hedge Funds and Elliott Waves – Netflix $NFLX
  • When Elliott Waves applauds the promoter’s signals!

WaveTimes is a Research Organization dedicated to providing original analysis, reports, reviews, and insights on developments in mutual funds, stocks, investing, foreign exchange, commodities, and bonds.

Contact WaveTimes

L-601 Mantri Espana,

Kariyammana Agrahara, Bellandur, Bangalore 560103

Follow Us

  • Facebook
  • YouTube
  • Twitter

© 2023 Wave Times. All Rights Reserved.
  • About
  • Books
  • Privacy Policy
  • Policies and Standards

Type above and press Enter to search. Press Esc to cancel.