• About
  • Elliott Waves
    • Elliott Waves Explained
    • Elliott Wave Magic Illustrated with Wave Charts
    • Elliott Wave Edge – How Elliott Wave Traders Win
    • Fibonacci Number Series and Elliott Waves
    • How to use Fibonacci Ratio Retracements
    • Elliott Wave Books
      • The Elliott Wave Book – Five Waves to Financial Freedom
      • Dividend Growth Investing Using Elliott Waves
    • Videos
  • Equities
    • Indices
      • Africa
        • Egypt
      • Australia
      • European Indices
        • AEX – Index, Amsterdam
        • DAX Index
        • Istanbul
        • Russia
        • Spain’s IBEX 35
      • Asian Indices
        • India
        • China
        • Dubai
        • Kuwait
        • Kuala Lumpur
        • Pakistan
        • Saudi
        • Taiwan
      • US Indices
        • S&P500
        • Nasdaq
        • Dow Jones
        • Dow Jones Utilities
    • Stocks
      • Asian Stocks
        • Indian Stocks Trading
        • Dubai Stocks Outlook
        • Japanese Stocks
        • Kuwait stocks
        • Saudi Stocks Outlook
      • African Stocks
        • Egyptian Stocks
      • Swiss Stocks
      • Australian Stocks
      • European Stocks
      • US Stocks outlook
      • UK Stocks
  • Commodities
    • Copper
    • Gasoline
    • Gold
    • Natural Gas
    • Oil
    • Palm Oil
    • Raw Sugar
    • Rubber
    • Soybean Oil
    • Silver
  • Forex
    • AUD
    • Bitcoin
    • CAD
    • CHF
    • Euro
    • GBP
    • INR
    • NZD
    • JPY
  • Raves
  • Consulting
    • Consulting
  • Ramki’s Watchlist
Top News

Has Meta (Facebook) stock seen the bottom

March 21, 2022

What Is The Nearest Technical Support For Meta (NASDAQ: FB)

February 7, 2022

Using Elliott Waves to Capture a Trade in S&P500

January 27, 2022
Facebook Twitter Instagram
WaveTimes Blog WaveTimes Blog
Wave times
  • About
  • Elliott Waves
    • Elliott Waves Explained
    • Elliott Wave Magic Illustrated with Wave Charts
    • Elliott Wave Edge – How Elliott Wave Traders Win
    • Fibonacci Number Series and Elliott Waves
    • How to use Fibonacci Ratio Retracements
    • Elliott Wave Books
      • The Elliott Wave Book – Five Waves to Financial Freedom
      • Dividend Growth Investing Using Elliott Waves
    • Videos
  • Equities
    • Indices
      • Africa
        • Egypt
      • Australia
      • European Indices
        • AEX – Index, Amsterdam
        • DAX Index
        • Istanbul
        • Russia
        • Spain’s IBEX 35
      • Asian Indices
        • India
        • China
        • Dubai
        • Kuwait
        • Kuala Lumpur
        • Pakistan
        • Saudi
        • Taiwan
      • US Indices
        • S&P500
        • Nasdaq
        • Dow Jones
        • Dow Jones Utilities
    • Stocks
      • Asian Stocks
        • Indian Stocks Trading
        • Dubai Stocks Outlook
        • Japanese Stocks
        • Kuwait stocks
        • Saudi Stocks Outlook
      • African Stocks
        • Egyptian Stocks
      • Swiss Stocks
      • Australian Stocks
      • European Stocks
      • US Stocks outlook
      • UK Stocks
  • Commodities
    • Copper
    • Gasoline
    • Gold
    • Natural Gas
    • Oil
    • Palm Oil
    • Raw Sugar
    • Rubber
    • Soybean Oil
    • Silver
  • Forex
    • AUD
    • Bitcoin
    • CAD
    • CHF
    • Euro
    • GBP
    • INR
    • NZD
    • JPY
  • Raves
  • Consulting
    • Consulting
  • Ramki’s Watchlist
WaveTimes Blog WaveTimes Blog
Home » BHEL uptrend gathers steam
Indian Stocks Trading

BHEL uptrend gathers steam

RamkiBy RamkiDecember 1, 201317 Comments2 Mins Read
Facebook Twitter LinkedIn Telegram Pinterest Tumblr Reddit WhatsApp Email
Share
Facebook Twitter LinkedIn Pinterest Email

After posting a significant low on 23 August 2013 at 100.15, BHEL uptrend has gathered steam and has closed above the weekly trend line resistance. Furthermore, it has closed ABOVE two recent tops. I had discussed the bullish possibilities for this stock in Elliott Wave Analysis of BHEL that was posted on 12th September in Wavetimes. Although the stock didn’t quite make it down to the preferred buy level, the directional clue given by Elliott Waves has proved correct. Let us now take a quick look at what key levels lie in the immediate vicinity.

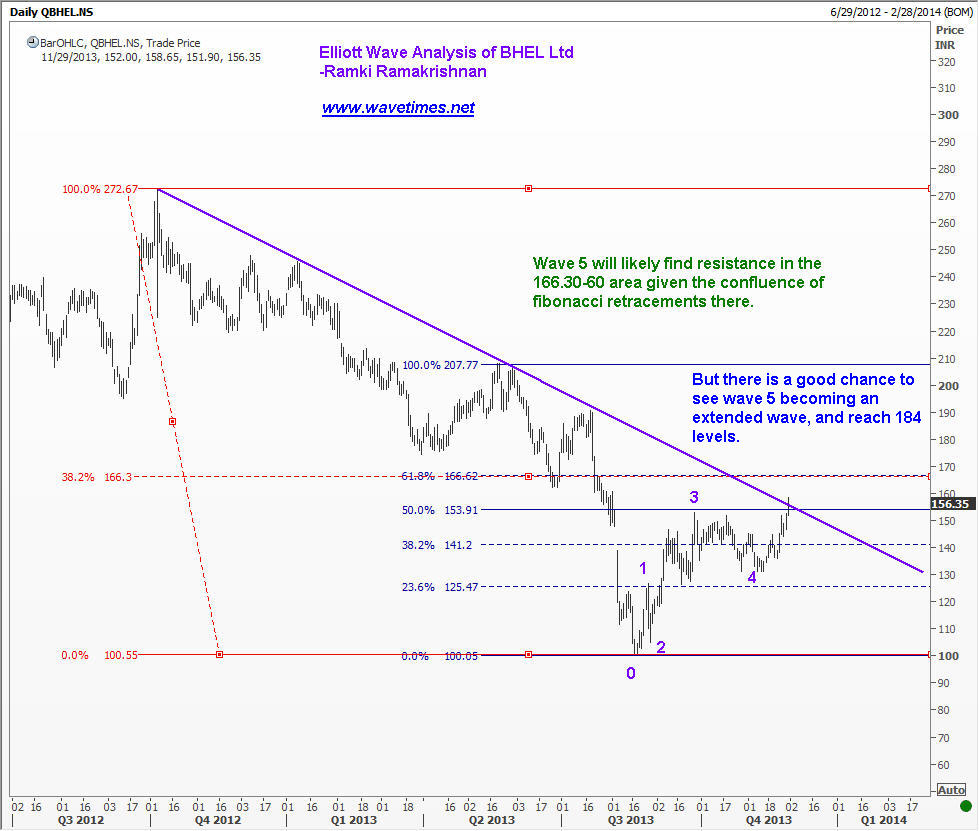
The chart you see below has some tentative Elliott Wave counts posted on it. It is important for you to understand that at this stage it is too early to confirm what will happen in the big picture. One thing, though, is clear. The 3rd wave did not bear the personality that is normally associated with it. So there is still a chance that this will turn out to be a double zigzag. But we need not worry about it just now. Given the current momentum, we shouldn’t be surprised to see a visit to 166 plus levels where there are some Fibonacci confluence levels. A gradual move to that level will mean it is time to take profits there. On the other hand, if it explodes higher, the stock can end up compensating the slow performance in wave 3 by having a very strong 3rd wave within an extended 5th. I am mentioning all this because trading the market using Elliott Waves is different from posting a chart with the waves neatly shown after the move is over. We need to be aware of various possibilities, and have a clear cut strategy carved out in advance. In the meanwhile, I would like to consider buying a small amount on any dip to near 152.70 with a stop below 152. That is a small risk to capture a move to 166 and beyond. While we are trying to limit our risk here, the uptrend in BHEL will be called into question only if we trade below 144.65, which is the top of wave 1 inside the current 5th wave.

BHEL uptrend

Share. Facebook Twitter Pinterest LinkedIn Tumblr Telegram Email
Previous ArticleElliott Waves Don't Guarantee a Profit
Next Article Farewell 2013
Ramki
  • Website

Related Posts

When Elliott Waves applauds the promoter’s signals!

January 3, 2022

A soft quarter for TCS – Avoid or Add – Contd.

October 13, 2021

A soft quarter for TCS — Avoid or add?

October 12, 2021
View 17 Comments

17 Comments

  1. prabh on December 2, 2013 8:49 am

    Ramki Sir,

    3rd Wave of Bhel was already an extended wave which got completed close to 1.70 Fib ratio.Hence should not there be remote chances of getting another extended 5th wave?

    Reply
  2. Mahesh on December 7, 2013 6:58 pm

    Hi Ramki,
    I am reading your book and have question regarding reflex point mentioned in ‘Chapter 5 Impulse Waves: Wave 1’. You have mentioned that we should look for a rally past the reflex point (wave 4 within C of the last correction) and then wait for a correction to enter. My question is does the rally (wave 1 of new trend) always go past the reflex point or does it sometimes end even before reaching the reflex point? So in this scenario we have the wave of the new rally ending before the reflex point and then the wave 2 is formed and so on.

    Reply
    • Ramki Ramakrishnan on December 9, 2013 8:46 pm

      Mahesh, If you go to lower degree, yes, you could have a 5 wave move ending below the reflex point, buy in all likelihood, you would then be also validating against a wave 4 of the minor 5th wave inside the wave 5 and so on!! The spirit of the wave principle is to find clues that will help you trade sensibly. And you don’t have to prove it to anyone else. You identify your levels, take your chances, and reap the rewards. So you can be completely honest to yourself. This is the approach I would recommend to any trader attempting to use EWP.

      Reply
      • Mahesh on December 11, 2013 8:04 am

        Ok, So I guess the reflex point is the 4th wave (1 degree lower) within the 5th wave of the last corrective wave. And we ought to look out for the rally (wave 1) past the reflex point and then we enter at 50% entrancement (wave 2) of this rally.

        Also Ramki I am now trying to put to practice this approach and finding difficulty in identifying the nature of the wave. For example in 1 minute chart I can see such setups where a reflex point is made and then a rally takes place past the reflex point but I am not sure if this rally (potential wave 1) is made up of 3 waves or 5 waves. I could fit in 3 or 5 waves without breaking the principles of elliot waves (the 3 main rules). One of the conditions mentioned by you is that the rally wave should be made of 5 waves and tiny wave 3 be not equal to tiny wave 1. How can i be certain that the move is 5 waves and not 3 waves?

        Reply
        • Ramki Ramakrishnan on December 11, 2013 6:48 pm

          Mahesh, it will not be possible to cover all these points by writing. But one piece of advice I can give you is to focus on the slightly bigger picture. Even experienced analysts face a lot of difficulty when dealing with very short time frames.

          Reply
  3. Manuel on December 11, 2013 8:04 pm

    Hello Sir:

    I am bit confused about extended waves, that said the normal length of wave 5 is the length of wave 1, if the 3rd wave is extended. But if the third wave is extended, could it be possible -without an extension in the fifth- that the fifth wave has a length equal to 61,8% of the total length from 0 to 3?

    Many thanks a have a great day.

    Reply
    • Ramki Ramakrishnan on December 14, 2013 9:00 pm

      Manuel, Yes it is possible that wave 5 = 61.8% of the distance from 0 to 3 even if wave 5 is not extended.

      Reply
      • Manuel Cavero on December 15, 2013 10:19 pm

        Thanks a lot, Ramki.

        Have a nice week!!

        Reply
  4. prabh on December 14, 2013 8:31 pm

    Ramki Sir,

    In terms of Fib ratio,when is fifth wave considered as an extended wave?Apologies for this basic question but in the book its stated any thing beyond 1.618 is considered as extended.I am confused as whether this is just for 3rd Impulsive wave or includes 5th wave as well.

    Reply
    • Ramki Ramakrishnan on December 14, 2013 9:05 pm

      Prabh, If waves 1 and 3 are both normal, and if wave 5 is larger than either of the other two impulses, and if it is greater than 61.8% of the distance from 0 to 3, I would say we are seeing an extended 5th.

      Reply
  5. Piyush Goyal on December 15, 2013 8:34 pm

    Sir,

    Wow, the 5th wave ended very near to 180 level as per your analysis.

    Now looking to above analysis and discussions and current Nifty view, I can assume that now BHEL is offering me a great investment opportunity at completion of a-b-c correction of first impulse wave somewhere around 130 levels with stop loss below 100 (if I may have interpreted wrongly) and 3rd wave target to be minimum at around 220 levels.

    Sir, I don’t want to know weather this analysis is correct or not but can you guide me that, am I moving in the right direction with using EW principles?

    Regards,
    Piyush Goyal.

    Reply
  6. Mahesh on December 20, 2013 9:20 pm

    Hi Ramki, Thanks for taking the time out to reply to the questions. I am trading the Nifty hourly where currently, i believe, the 3rd wave is in progress. I followed the reflex point theory mentioned in your book and got in at 6154 yesterday. My question is: At what point during the 3rd wave should i revise my Stop Loss from start of wave 1 (point 0) to end of wave 1 (point1)?
    Thanks again for your kind guidance.
    Mahesh

    Reply
  7. sreevatsan seshadri on December 21, 2013 7:31 am

    Hi Ramki,
    What is the long term wave for BHEL, Can i take the 100 as end of Wave C or is it a 4th Wave in Wave C,

    Reply
  8. nanda kumar on December 24, 2013 8:24 am

    sir,
    If we watch BHEL which started its downtrend november 2010 and 5th wave ended at 2013 augest
    is there any rule that it should retrace to wave 5 starting point 272, can you please explain the correction
    of ABC, in this particular stock,though i am asking a impossiable question but for a experinced person like you can throw some light on this,
    thank you,

    Reply
    • Ramki Ramakrishnan on January 8, 2014 8:34 pm

      Nanda Kumar, Thank you for your comment. Are you sure that 5 waves are finished in 2013? If yes, then there is a tendency that we will eventually recover back to the start of wave 5, which is the end of wave 4.

      Reply
  9. Anandha on April 1, 2014 9:34 pm

    Hi Ramky,

    Now it looks BHEL is now at reflection point at around 208. Do you see that retracement to 140 levels can be bought into for 274/325/442 in coming year and half time frame?

    Reply
    • Ramki Ramakrishnan on April 19, 2014 11:11 am

      Ananda, Thanks for writing. I dont offer trade advice on this blog, but BHEL looks weak in the near term

      Reply

Leave A Reply Cancel Reply

Recent Posts
  • Has Meta (Facebook) stock seen the bottom
  • What Is The Nearest Technical Support For Meta (NASDAQ: FB)
  • Using Elliott Waves to Capture a Trade in S&P500
  • Hedge Funds and Elliott Waves – Netflix $NFLX
  • When Elliott Waves applauds the promoter’s signals!

WaveTimes is a Research Organization dedicated to providing original analysis, reports, reviews, and insights on developments in mutual funds, stocks, investing, foreign exchange, commodities, and bonds.

Contact WaveTimes

L-601 Mantri Espana,

Kariyammana Agrahara, Bellandur, Bangalore 560103

Follow Us

  • Facebook
  • YouTube
  • Twitter

© 2022 Wave Times. All Rights Reserved.
  • About
  • Books
  • Privacy Policy
  • Policies and Standards

Type above and press Enter to search. Press Esc to cancel.