• About
  • Elliott Waves
    • Elliott Waves Explained
    • Elliott Wave Magic Illustrated with Wave Charts
    • Elliott Wave Edge – How Elliott Wave Traders Win
    • Fibonacci Number Series and Elliott Waves
    • How to use Fibonacci Ratio Retracements
    • Elliott Wave Books
      • The Elliott Wave Book – Five Waves to Financial Freedom
      • Dividend Growth Investing Using Elliott Waves
    • Videos
  • Equities
    • Indices
      • Africa
        • Egypt
      • Australia
      • European Indices
        • AEX – Index, Amsterdam
        • DAX Index
        • Istanbul
        • Russia
        • Spain’s IBEX 35
      • Asian Indices
        • India
        • China
        • Dubai
        • Kuwait
        • Kuala Lumpur
        • Pakistan
        • Saudi
        • Taiwan
      • US Indices
        • S&P500
        • Nasdaq
        • Dow Jones
        • Dow Jones Utilities
    • Stocks
      • Asian Stocks
        • Indian Stocks Trading
        • Dubai Stocks Outlook
        • Japanese Stocks
        • Kuwait stocks
        • Saudi Stocks Outlook
      • African Stocks
        • Egyptian Stocks
      • Swiss Stocks
      • Australian Stocks
      • European Stocks
      • US Stocks outlook
      • UK Stocks
  • Commodities
    • Copper
    • Gasoline
    • Gold
    • Natural Gas
    • Oil
    • Palm Oil
    • Raw Sugar
    • Rubber
    • Soybean Oil
    • Silver
  • Forex
    • AUD
    • Bitcoin
    • CAD
    • CHF
    • Euro
    • GBP
    • INR
    • NZD
    • JPY
  • Raves
  • Consulting
    • Consulting
  • Ramki’s Watchlist
Top News

Has Meta (Facebook) stock seen the bottom

March 21, 2022

What Is The Nearest Technical Support For Meta (NASDAQ: FB)

February 7, 2022

Using Elliott Waves to Capture a Trade in S&P500

January 27, 2022
Facebook Twitter Instagram
WaveTimes Blog WaveTimes Blog
Wave times
  • About
  • Elliott Waves
    • Elliott Waves Explained
    • Elliott Wave Magic Illustrated with Wave Charts
    • Elliott Wave Edge – How Elliott Wave Traders Win
    • Fibonacci Number Series and Elliott Waves
    • How to use Fibonacci Ratio Retracements
    • Elliott Wave Books
      • The Elliott Wave Book – Five Waves to Financial Freedom
      • Dividend Growth Investing Using Elliott Waves
    • Videos
  • Equities
    • Indices
      • Africa
        • Egypt
      • Australia
      • European Indices
        • AEX – Index, Amsterdam
        • DAX Index
        • Istanbul
        • Russia
        • Spain’s IBEX 35
      • Asian Indices
        • India
        • China
        • Dubai
        • Kuwait
        • Kuala Lumpur
        • Pakistan
        • Saudi
        • Taiwan
      • US Indices
        • S&P500
        • Nasdaq
        • Dow Jones
        • Dow Jones Utilities
    • Stocks
      • Asian Stocks
        • Indian Stocks Trading
        • Dubai Stocks Outlook
        • Japanese Stocks
        • Kuwait stocks
        • Saudi Stocks Outlook
      • African Stocks
        • Egyptian Stocks
      • Swiss Stocks
      • Australian Stocks
      • European Stocks
      • US Stocks outlook
      • UK Stocks
  • Commodities
    • Copper
    • Gasoline
    • Gold
    • Natural Gas
    • Oil
    • Palm Oil
    • Raw Sugar
    • Rubber
    • Soybean Oil
    • Silver
  • Forex
    • AUD
    • Bitcoin
    • CAD
    • CHF
    • Euro
    • GBP
    • INR
    • NZD
    • JPY
  • Raves
  • Consulting
    • Consulting
  • Ramki’s Watchlist
WaveTimes Blog WaveTimes Blog
Home » Elliott Wave Analysis of BHEL
Indian Stocks Trading

Elliott Wave Analysis of BHEL

RamkiBy RamkiSeptember 12, 201318 Comments2 Mins Read
Facebook Twitter LinkedIn Telegram Pinterest Tumblr Reddit WhatsApp Email
Share
Facebook Twitter LinkedIn Pinterest Email

This post originally appeared on Wavetimes.com on 26August 2013 and has been restored after a crash of the database. Hence the date is shown differently above. My apologies to those who posted comments, as these have been lost too:

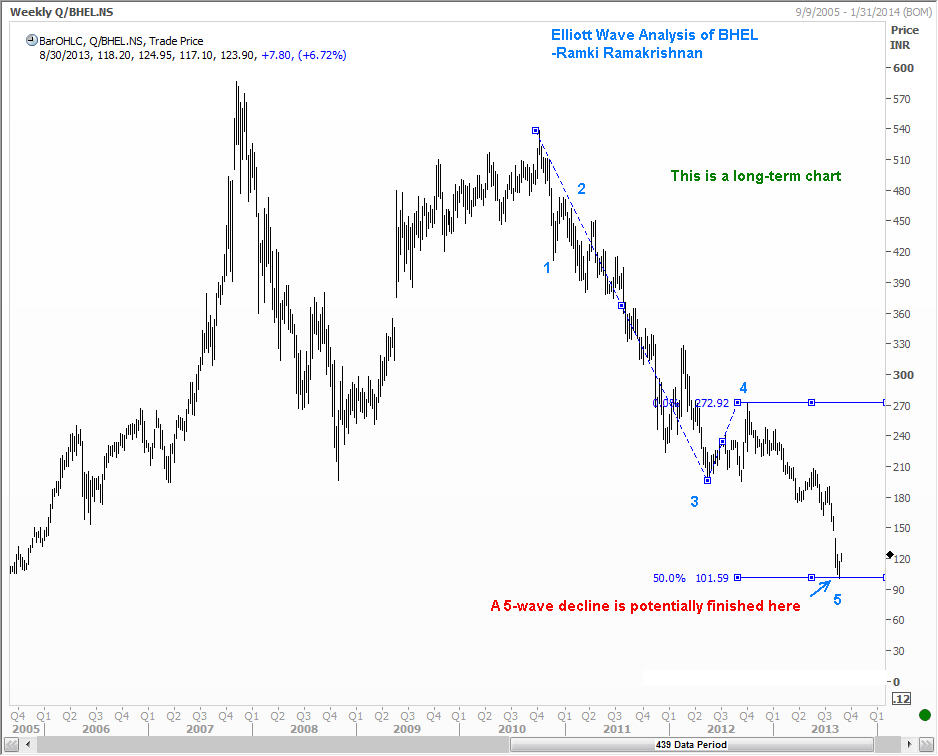
What is the outlook for BHEL? Has BHEL seen a significant low at 100.35? Should we buy BHEL on the next dip? What does Elliott Wave analysis suggest for BHEL? Let us start with a long term (weekly) chart of BHEL. Wave 5 that started around Rs 270 seems to have posted a 50% measure of the distance from 0 to 3.

BHEL28Aug13c

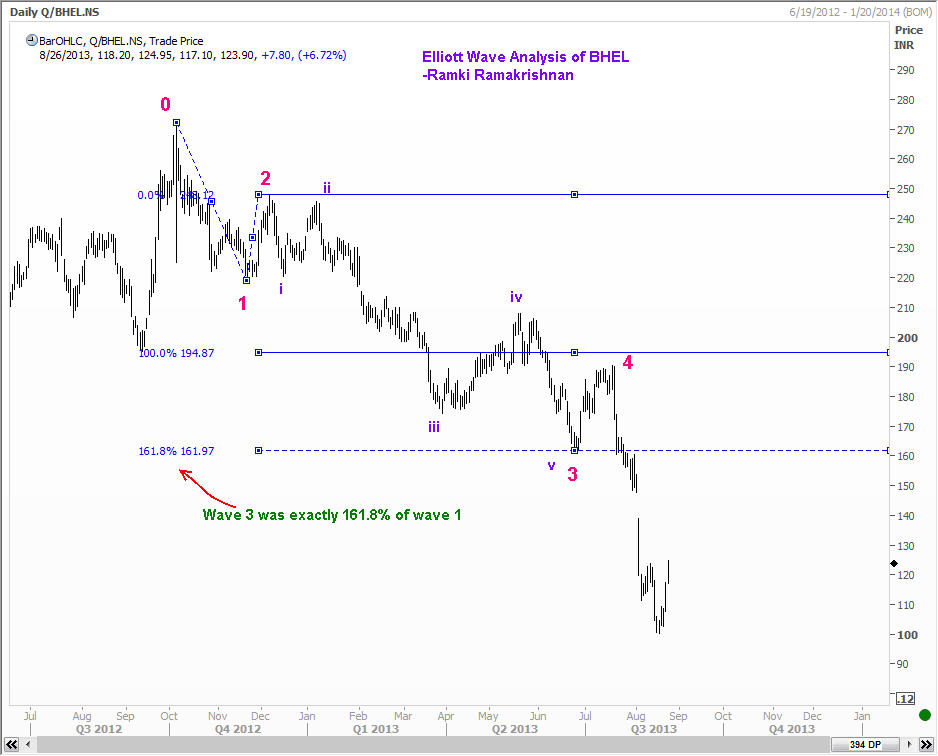
Next, let us look at the moves from 270 in detail. The first chart below shows that at 161.97, wave 3 was exactly 161.8% of wave 1. And the second chart of BHEL shows that we have already been to 78.6% of the distance from 0 to 3.

BHEL28Aug13a

BHEL28Aug13b
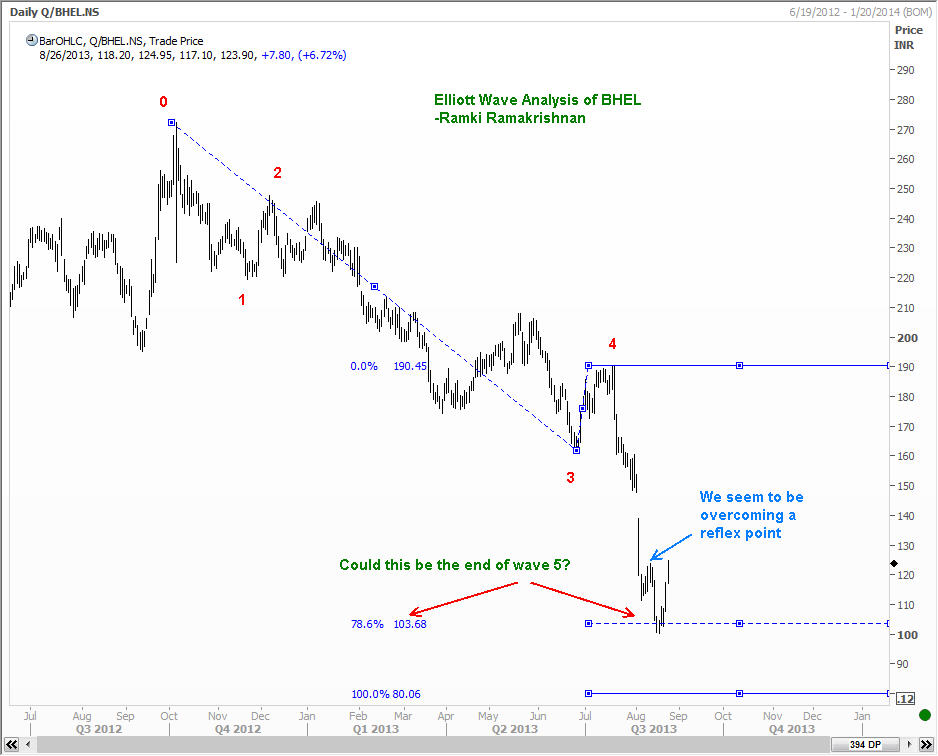
On top of that , we seem to have just exceeded a reflex point. Despite all this, the weekly chart looks quite bearish and we shouldn’t be surprised if the stock fails to overcome the 140 levels, and to attempt another test of the recent lows.

Next, take a look at another Elliott Wave count for BHEL, shown in the chart below.

BHEL28Aug13d

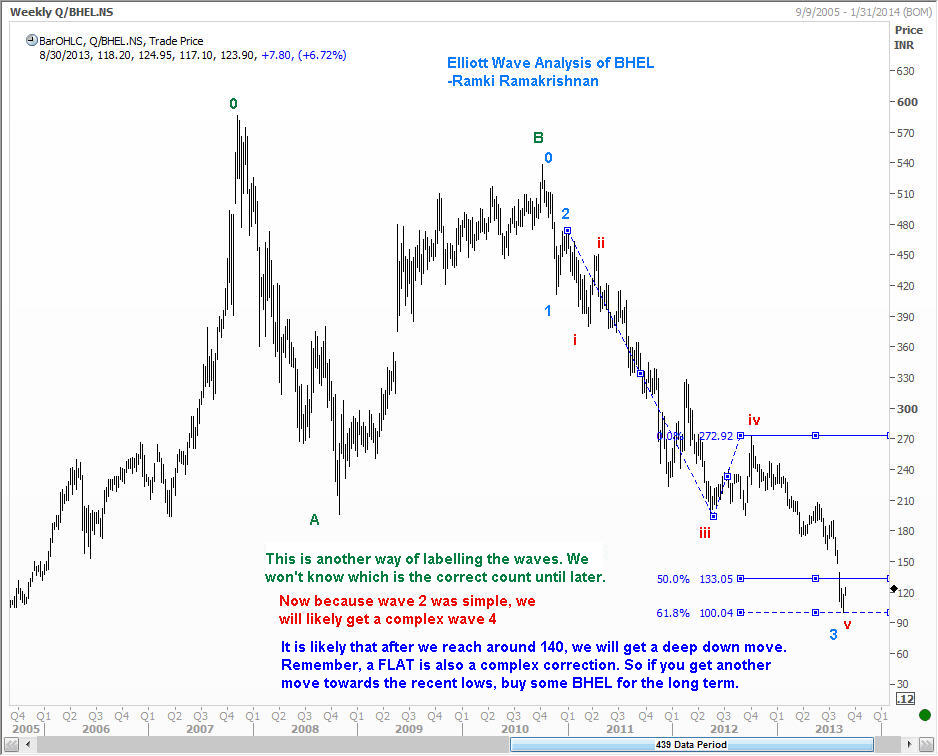
This chart would suggest that we have just finished a 3rd wave, and a complex fourth wave is likely to be seen. A complex correction could take many forms, and one of the most common corrections is a ‘flat’ correction where wave B reaches or exceeds the starting point of wave A. So, if you see a failure around 140, that could well be a trigger for a retest of the lows. It might be a good idea to consider buying some BHEL near there for the medium term. We will revisit the charts when it gets there, just to make sure that the decline has the personality of a B wave. Will someone please send me a reminder at that time.


BHEL
Share. Facebook Twitter Pinterest LinkedIn Tumblr Telegram Email
Previous ArticleTrading MSFT after Steve Ballmer news
Next Article Elliott Wave Analysis of Dubai Stock Index
Ramki
  • Website

Related Posts

When Elliott Waves applauds the promoter’s signals!

January 3, 2022

A soft quarter for TCS – Avoid or Add – Contd.

October 13, 2021

A soft quarter for TCS — Avoid or add?

October 12, 2021
View 18 Comments

18 Comments

  1. Vijayanand on September 13, 2013 8:33 am

    Ramki Sir,

    Now Bhel Reach 144 Coming Down side …….so When can we buy the stock for medium term around 90 level sir……..

    Reply
    • Ramki Ramakrishnan on September 13, 2013 12:28 pm

      Vijayanand, If you are a trader you will buy any stock when a correction ends. As of now, we are still looking bid. As BHEL starts coming off again, we need to look out for clues about possible end points of the correction and determine where to buy. Now is not the time to anticipate where the next correction will end.

      Reply
  2. praveen on September 13, 2013 3:25 pm

    Hi Ramki,

    i am reading your book again..you mentioned that entry for wave 1 (recent lowest point) and refex point also..so if we take that lowest point as starting of 1 ? (recent low is 100.15)

    wave 1 corrected start at 100.15 and travel till 126.9 and corrected (78.6%) of wave 1

    wave 2 to wave 3 travel 138.2% now we are in wave 4th and it might be complex correction if my wave count is correct BHEL wont come down below 126.9 (wave 1 top)

    please suggest me if my wave count is correct or not ?

    Thanks in advance

    Reply
    • Ramki Ramakrishnan on September 17, 2013 7:07 pm

      Praveen, I would like you to think that your count is as good as any other person’s provided you have followed the rules and guidelines I have explained in my book. You start the count from a significant low and then figure it out! It is also possible that another person can have a different wave count and both of you could be right ( or wrong) and both could make or lose money. It all boils down to whether you were patient enough to spot a low-risk entry level and also get out the moment your count is proved wrong.

      Reply
  3. Dr Sanjay Pote on September 13, 2013 6:29 pm

    Good Evening dear Ramki. I am not sure about the weekly chart but on the daily and Hrly chart it looks like Bhel has started an Impulse wave on the upside from 100 levels. It is the no.1 Nifty gainer today closing at 143. After reaching 127 from 100 it corrected deeply by 80 % at 105 levels which can be the 2nd or the B wave. The 3rd or C wave ended at exactly 161.8% projection at 147. The 4th gave a complex correction ending at 134 which was 38.2% retracement and presently it has started the 5th wave on the upside which can probably extend as wave 3 was normal (161.8%) . The min. posssible target seems to be at 165 levels ( 61.8 % and the channel top) as of now.
    Kindly correct me if I am wrong.
    Thanks and regards.

    Reply
    • Ramki Ramakrishnan on September 17, 2013 6:59 pm

      Hi Dr Sanjay, you seem to have gained a deeper understanding of EWP! But when you have a hypothesis you should do a few things. First, know where your view will be wrong. Second trade the view if you can afford a stop where your view will be proved wrong! Good luck.

      Reply
  4. Dr Sanjay Pote on September 19, 2013 3:58 am

    Thank you dear Ramki for your encouraging statement. I owe this to your consistent,simple and effective teaching and also to your Bible of FWTFF which I keep referring to and eagerly wait for your new post. Sorry for my delayed response. I will defenitely remember the above 2 things. By the way I think that Bhel just finished wave 4 on the downside at the low of 126.20 and closing at 129.75, 50 % correction of wave 3.
    Thanks and regards.

    Reply
    • spk on September 24, 2013 9:05 am

      dear sanjay..i am sorry to add my query to your post..as per EWF wave 4 never come below wave 1..please it just enter below wave 1 and went up..may be need to change your count..

      sorry if my analysis worng

      Reply
  5. Venugopal K on September 24, 2013 9:27 pm

    Dear Ramki,
    Elliot wave analysis of BHEL:
    Thanks for your wonderful book on Elliot wave analysis and have been reading it lately and started implementing it in a small way. I fully agree with Dr.Sanjay that BHEL as of now appears to have completed the 4th wave (not yet definitely confirmed) and in the start of the 5 th wave. It has followed the elliot wave principles that wave 2 has not gone below the start of wave 1 . Also wave 4 has not gone below the end of wave 1 during its correction and correction was close to 50% of wave 3. It appears that BHEL may not retest its recent low of 100.35 and its the best time to buy BHEL around the present levels and sell it during the end of wave 5 which is likely to be an extended wave. But as you said a careful watch is required to confirm that wave5 has ended. I am eager to enter the scrip at the current levels around 131.40 Please let me know your views.

    Reply
  6. Venugopal K on September 25, 2013 8:31 pm

    Dear Mr.Ramki,
    Looks like BHEL has started its upward move. Maybe tomorrow Thursday last day of carry forward, some reaction downwards or profit booking is expected in BHEL. Finally the trend will be up and likely the present 5th wave will be extended.

    Reply
  7. Venugopal K on October 22, 2013 7:25 pm

    Dear Mr.Ramki,
    Hope you had a enjoyable holiday and fresh to post messages. Looks like BHEL is likely to go down from 140.60 traded on 22-10. From your analysis, crrective waves of A,B completed and wave C has traced only 3 waves instead of 5 waves. Two more minor waves are left to be traced to complete Wave C and BHEL will now react to lower levels. My earlier analysis is not OK. Please comment.

    Reply
    • Ramki Ramakrishnan on October 22, 2013 9:06 pm

      Venugopal, I had given two ways of counting BHEL. THe key point was in the bigger picture, it made sense to accumulate the stock on dips. Of course, many readers are trying to learn from every twist and turn, which is OK too, so long as one makes a trading decision at key levels.

      Reply
  8. Venugopal K on November 13, 2013 5:34 pm

    Dear Ramki,
    Thanks for your reply.I need some clarifications from you.
    1) After Wave 5, the correction that sets in can take the price to very low levels. As you said correctly,one has to be vigil. Can you say what is the minimum correction and maximum that can be expected out of corrective waves A,B and C.Can it be predicted?
    2) When a stock becomes X Bonus or X split, whether we have to start the wave count from the beginning , that is wave 1?
    Hope to receive your reply.

    Reply
    • Ramki Ramakrishnan on November 13, 2013 6:00 pm

      Venugopal, The ‘extent’ of a 2nd wave correction and a 4th wave correction, including the maximum anticipated distance for each are all covered in my Elliott Wave Book – Five Waves to Financial Freedom. As for bonus or split or dividend, the whole chart will change to reflect the revised price pattern and it will be relatively easy for you to count again from the significant turning points.

      Reply
      • Venugopal K on November 13, 2013 9:27 pm

        Thanks.I am not talking about impulse waves 2 and 4 which are well documented. When we come to end of wave 5,which is then followed by corrective waves of A,B,C, I would like to know the extent of correction.

        Reply
        • Ramki Ramakrishnan on November 13, 2013 10:02 pm

          Venugpoal, when a cycle of 8 waves are completed, they could, for example, be considered wave 1 and 2 of the next degree. So the same guidelines apply in the higher degree

          Reply
  9. Ritesh on February 1, 2017 1:56 pm

    Ramki sir,
    Pl. let me remind you as asked in blog post. also want few ans. if possible.
    Is wave 1 started in 1995 n ended in 2010 n recently completed wave 2 ? OR
    as per blog count ABC corrective started in 2007 has been completed in march 2016 or december 2016 ?
    Is wave 3 has been started or another ABC corrective started on upside ?
    Thanks.

    Reply
    • Ramki Ramakrishnan on February 1, 2017 2:55 pm

      Ritesh, As mentioned in my book FWTFF, I prefer to leave the very big picture to others in the market. As far as BHEL is concerned, we got a move to near Rs 300 from near 100. That move amply compensates us for the time and effort we spent on that analysis. I generally discard a wave count once it has served its purpose.

      Reply

Leave A Reply Cancel Reply

Recent Posts
  • Has Meta (Facebook) stock seen the bottom
  • What Is The Nearest Technical Support For Meta (NASDAQ: FB)
  • Using Elliott Waves to Capture a Trade in S&P500
  • Hedge Funds and Elliott Waves – Netflix $NFLX
  • When Elliott Waves applauds the promoter’s signals!

WaveTimes is a Research Organization dedicated to providing original analysis, reports, reviews, and insights on developments in mutual funds, stocks, investing, foreign exchange, commodities, and bonds.

Contact WaveTimes

L-601 Mantri Espana,

Kariyammana Agrahara, Bellandur, Bangalore 560103

Follow Us

  • Facebook
  • YouTube
  • Twitter

© 2023 Wave Times. All Rights Reserved.
  • About
  • Books
  • Privacy Policy
  • Policies and Standards

Type above and press Enter to search. Press Esc to cancel.