Most people think that Elliott Wave analysis will work only on the major currencies such as the Euro, British Pound or Japanese Yen. However, I have clients from around the world, and this post showcases one consulting session with a client who trades in USDSGD. As you know, readers of this blog come here to learn, as this is a ‘living book’, an extension of Five Waves to Financial Freedom. If you could pick up some additional points from going through these charts, your time will have been well spent. Needless to say, the client from Singapore was amply rewarded by having advance notice of what was most likely to happen.
These charts were prepared on the 1st of January 2017 . The Singapore Dollar, or USDSGD had closed the year on 30 Dec 2016 at 1.4478. I recommend that you open all of the following charts in separate tabs so you can quickly flip from one to the next.
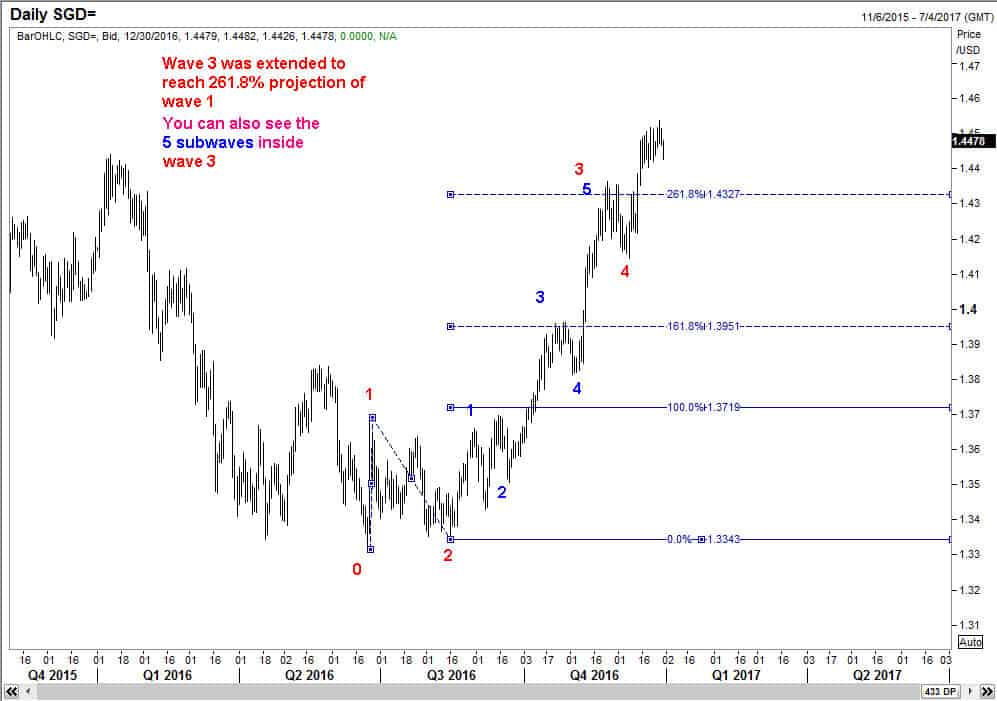
We start the wave count of USDSGD from the significant low of 1.3315 seen in June 2016.
USDSGD wave 3
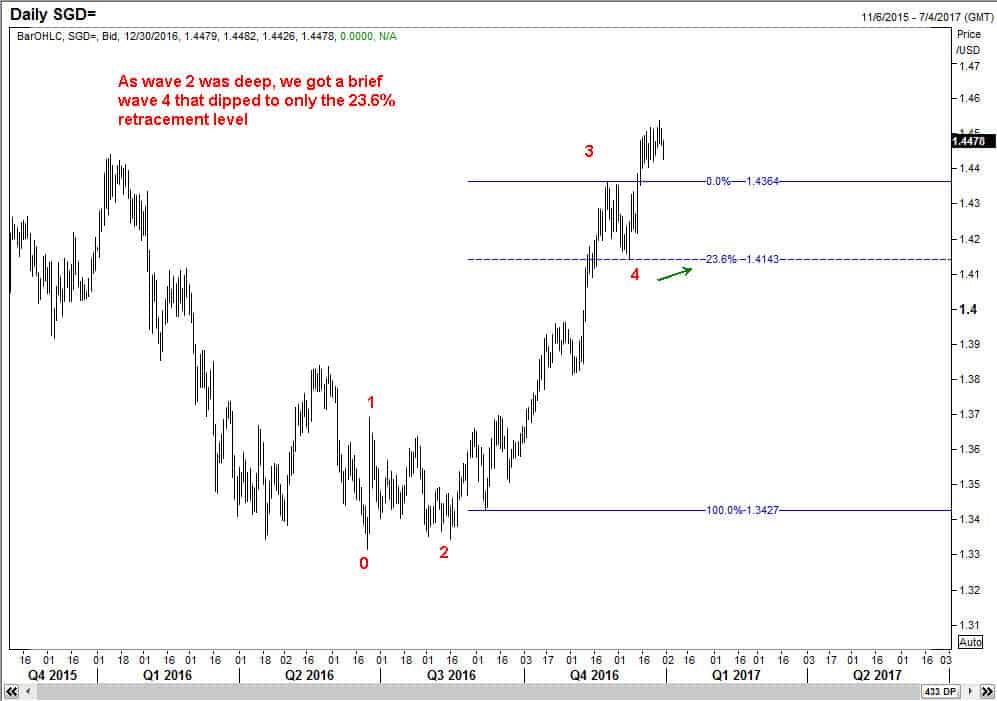
USDSGD wave 4
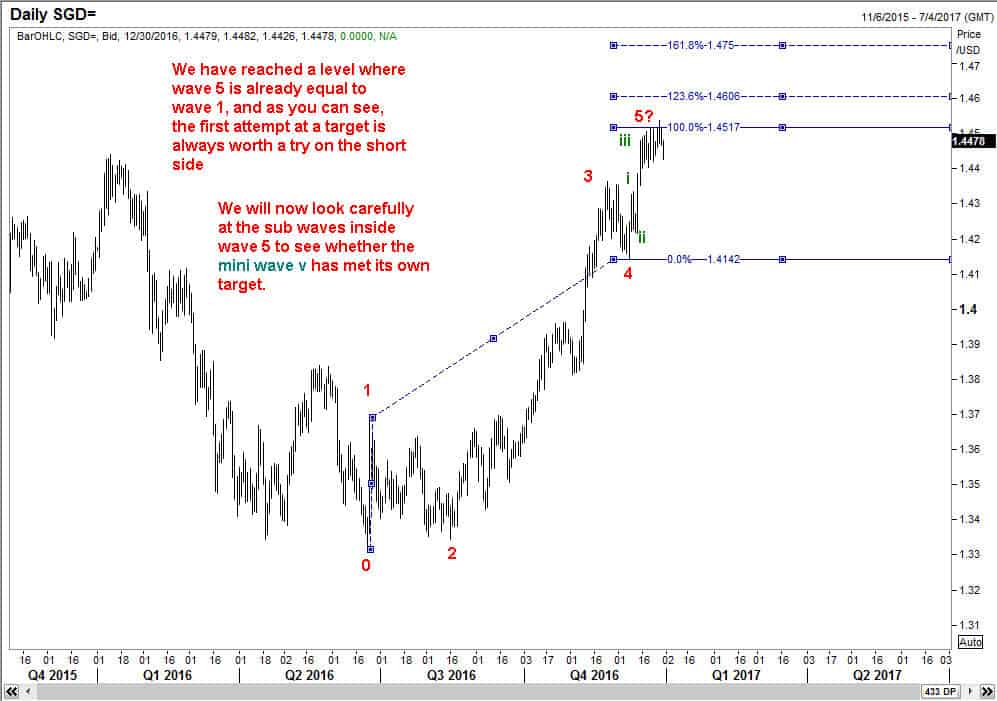
Potential end of wave 5 for USDSGD
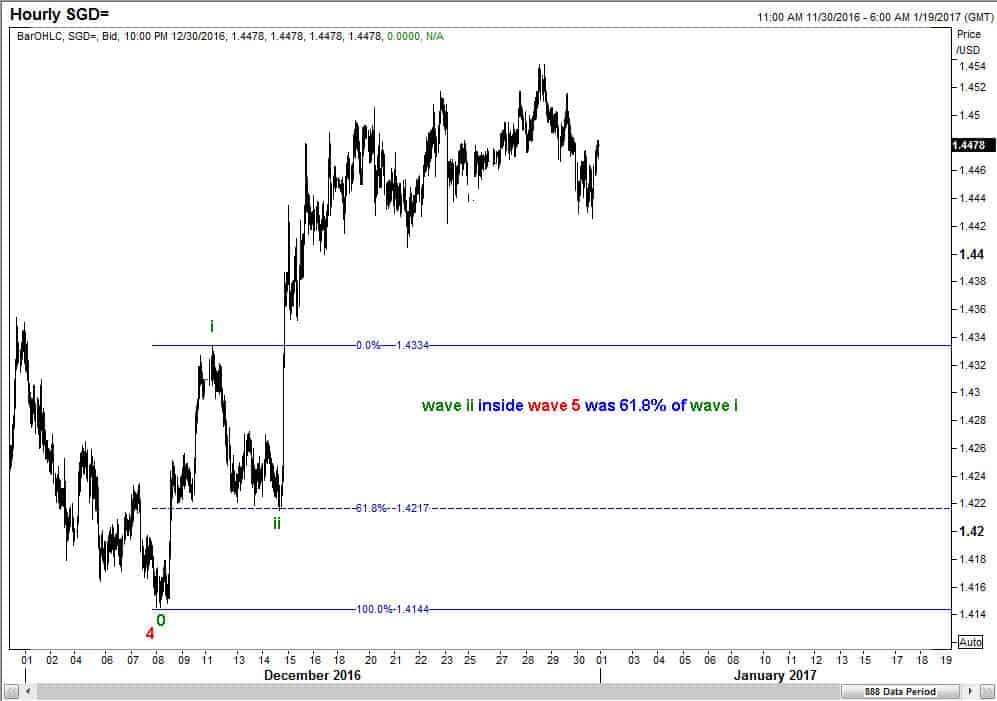
Sub waves inside wave 5 of USDSGD – sub wave ii
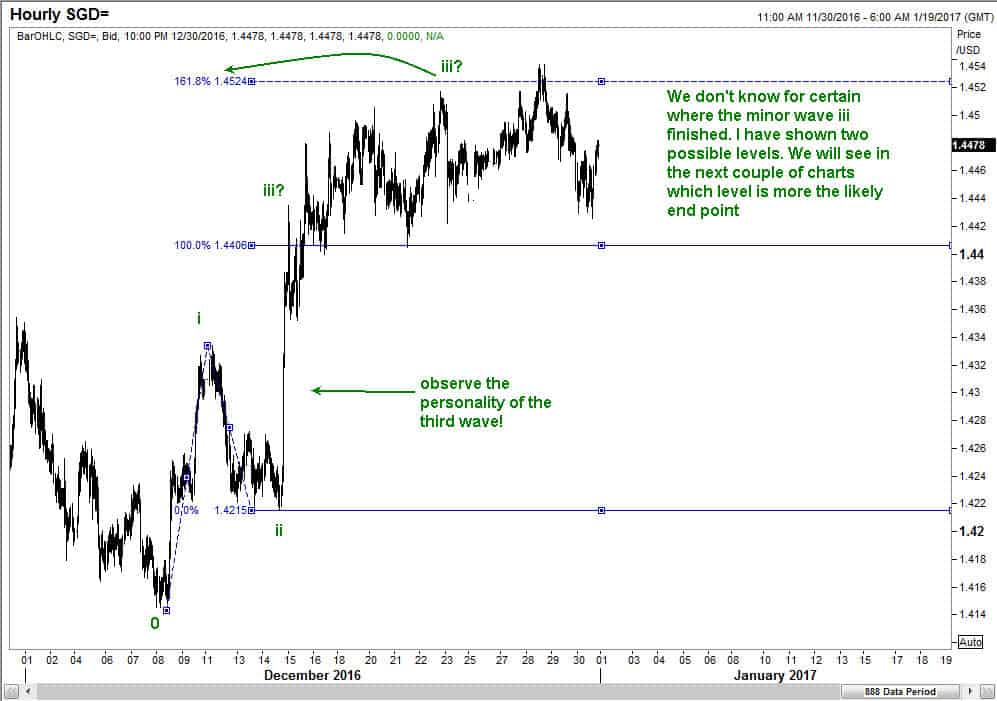
Deciding where sub wave iii finished
I am going to continue these charts in the next post to that we don’t make this one too long. Here is the link for that.
