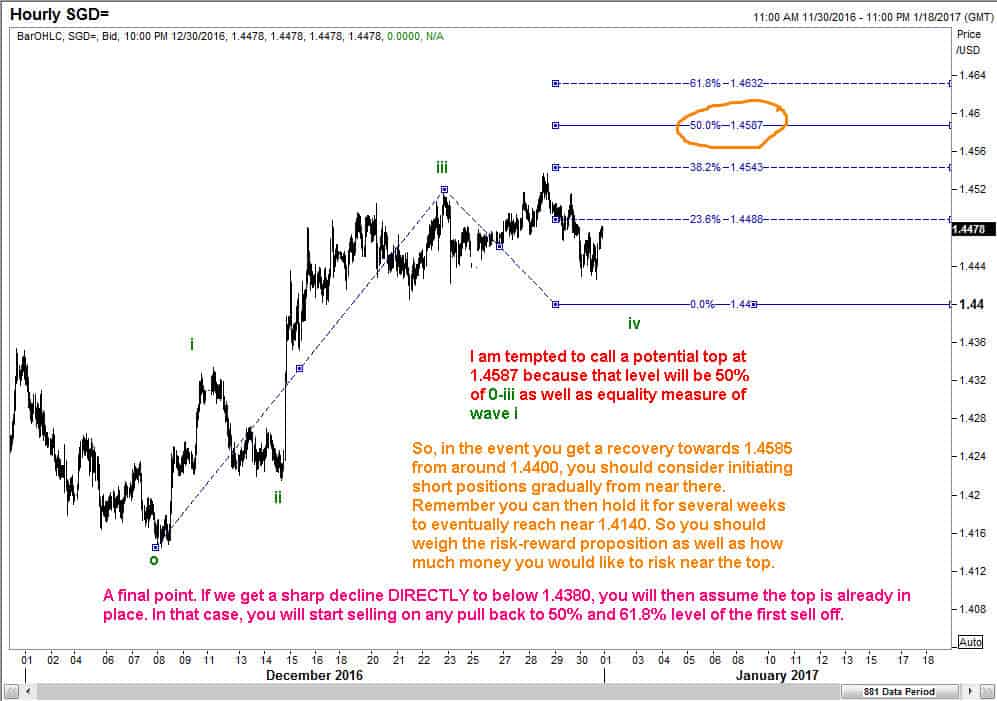
We saw a step-by-step review of the Elliott Wave counts for USDSGD up to the end of sub wave iii inside wave 5. Let us see what came next. These charts of USDSGD were prepared for a client based in Singapore on 1st January 2017, when the currency was trading at 1.4478.
Deciding where sub wave iv ended, thereby giving us confidence about wave iii as well
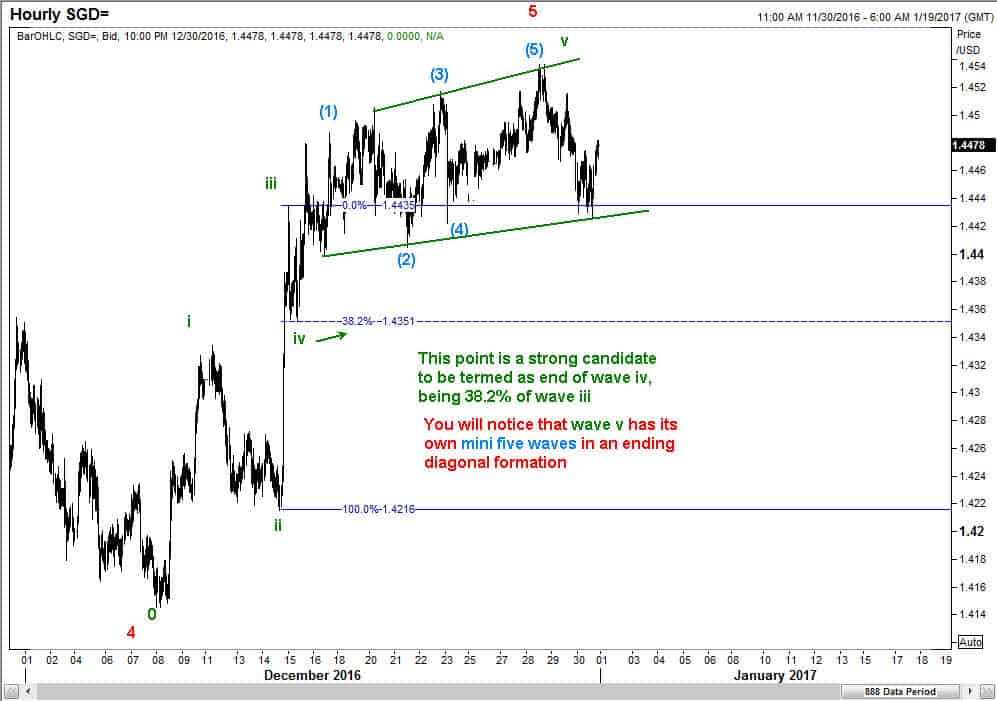
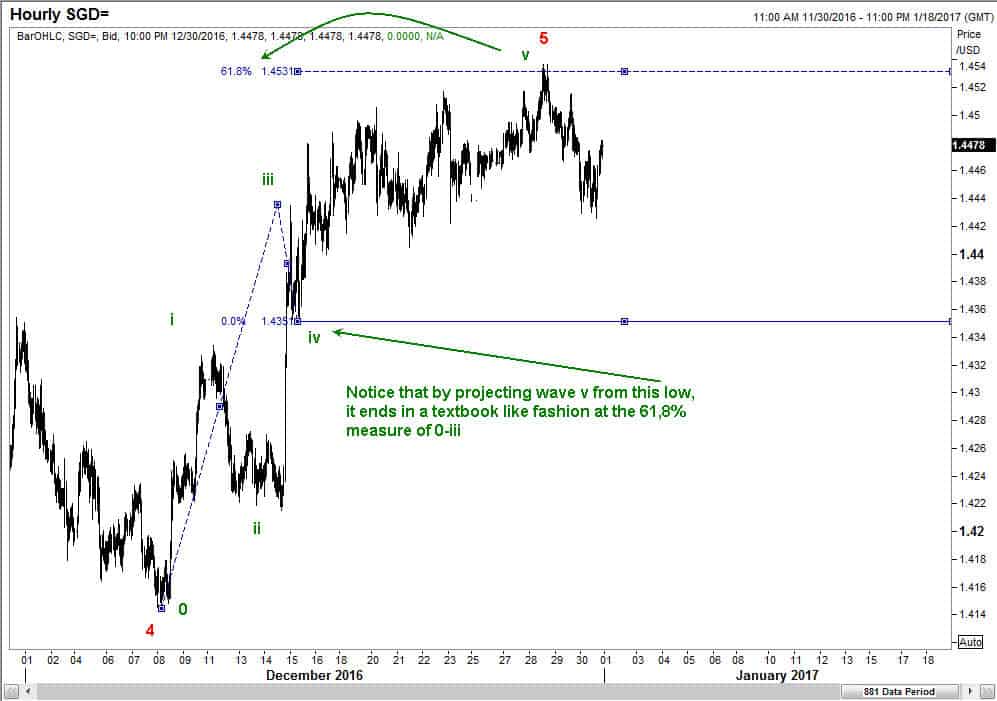
Computing the target for sub wave v
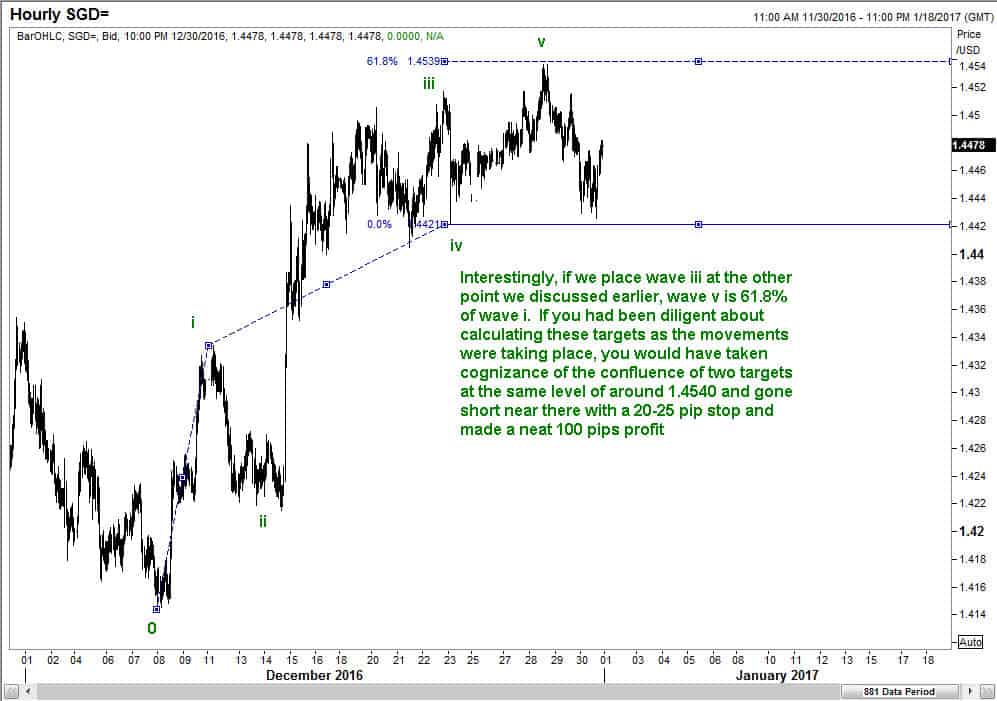
Alternate measure for sub wave v
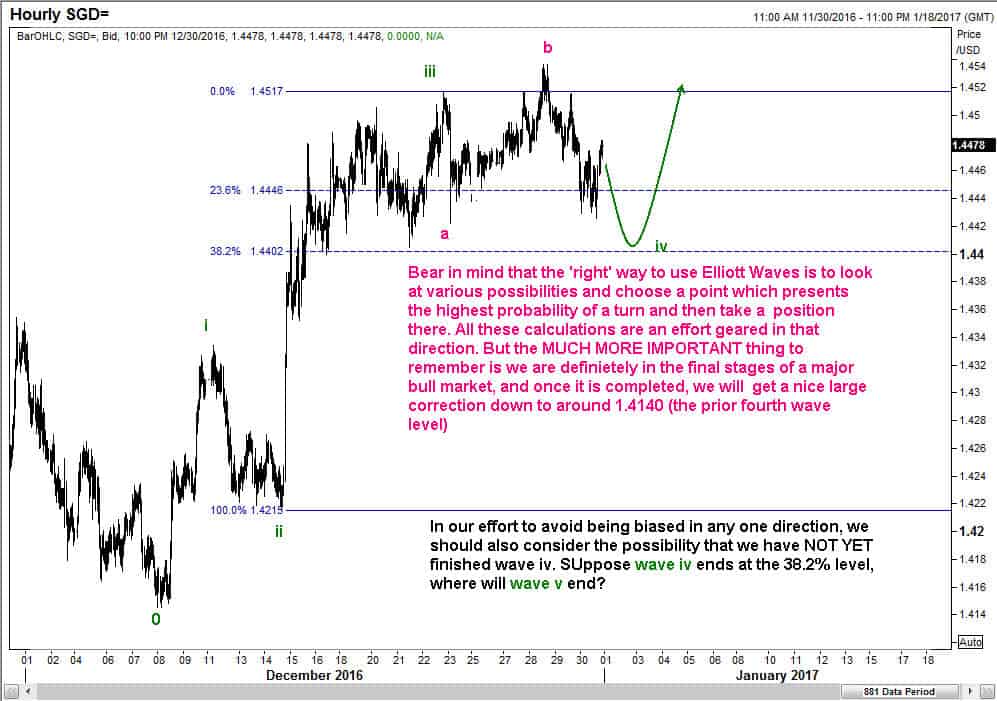
Anticipating the decline to 1.4140
Planning a short trade in USDSGD
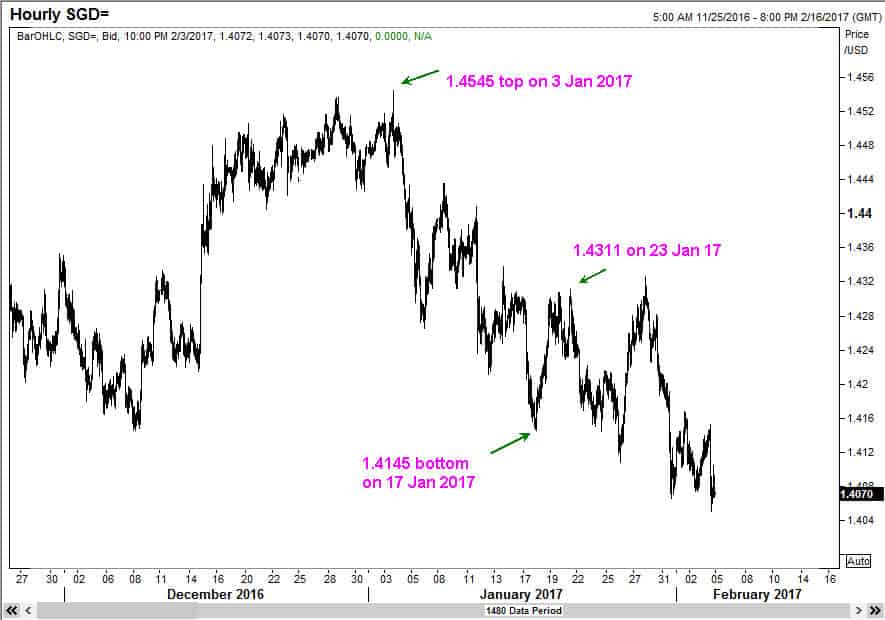
WHAT HAPPENED AFTERWARDS IN USDSGD
Well, that was just one consulting session with my client. I then followed it up with anticipating more turns. I am quite happy to send you one more lot, but for that, I am trying an experiment with social media. A link to this post will appear on Facebook. Can you try and share it with your friends and send me a message? Best wishes to all of you.
