In hindsight, it all seems so easy to make between 8% and 15% on Federal Bank Ltd stock. But the confidence comes from following a tested strategy. You too could have made that kind of money by carefully following a disciplined approach to the markets. The following charts are being shared as part of my mission to make this blog an extension of my book “Five Waves to Financial Freedom”.
On 17 May 2017, I sent out an email notification to all active members of the exclusive club (an active member is someone who has at least 1 credit in his or her account), informing them of a new trade idea. The stock in question was Federal Bank Ltd.
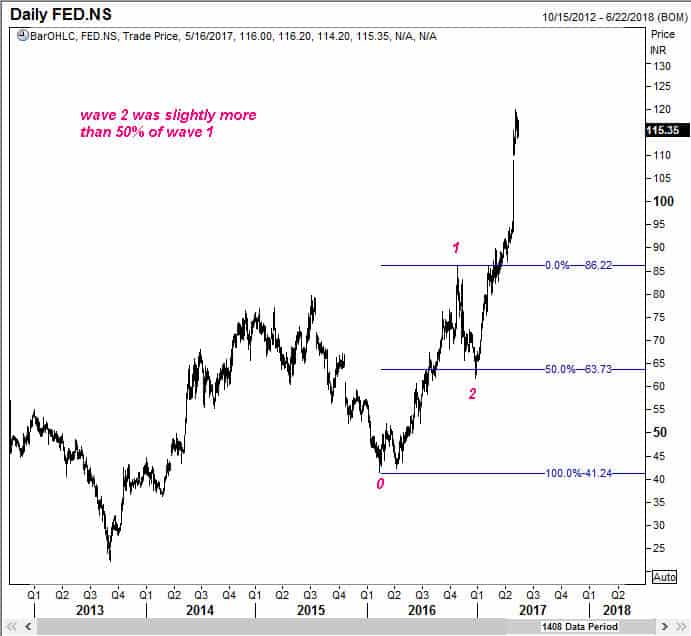
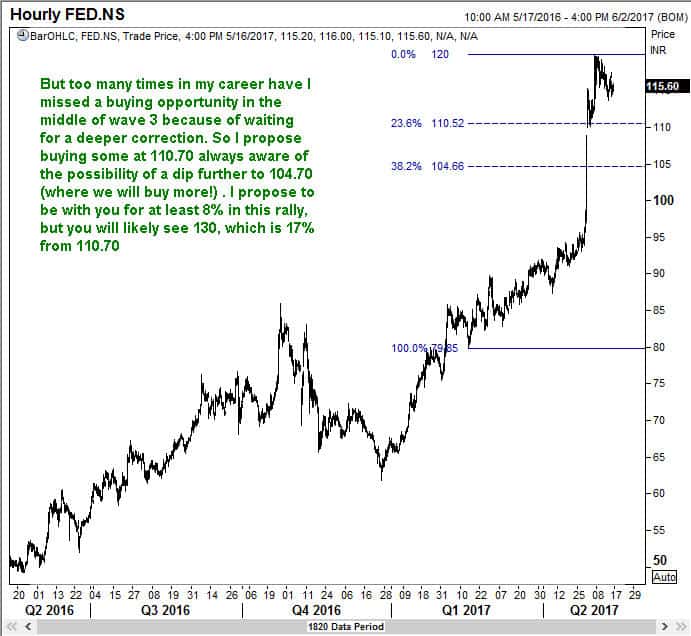
The stock was trading at 115.70 at that time, having come down from the 120 levels. The outlook appeared to be bullish and I promised to guide the members till we see 8%, although the upside was open to a lot more.
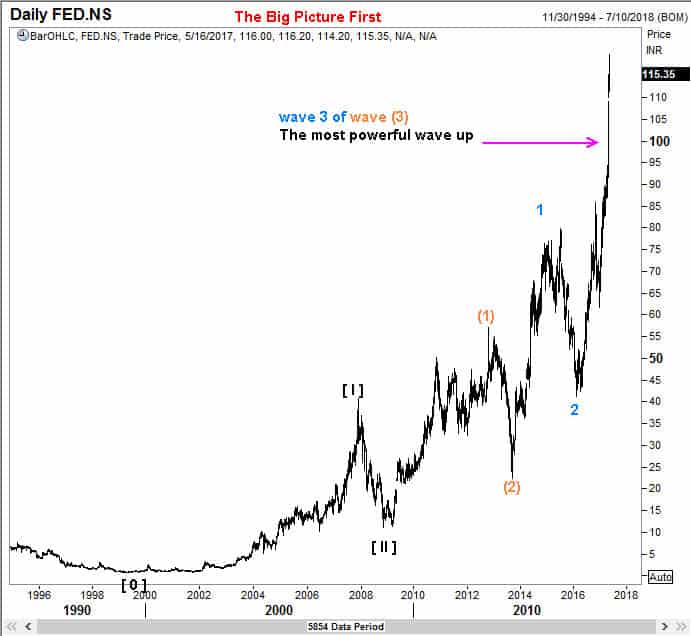
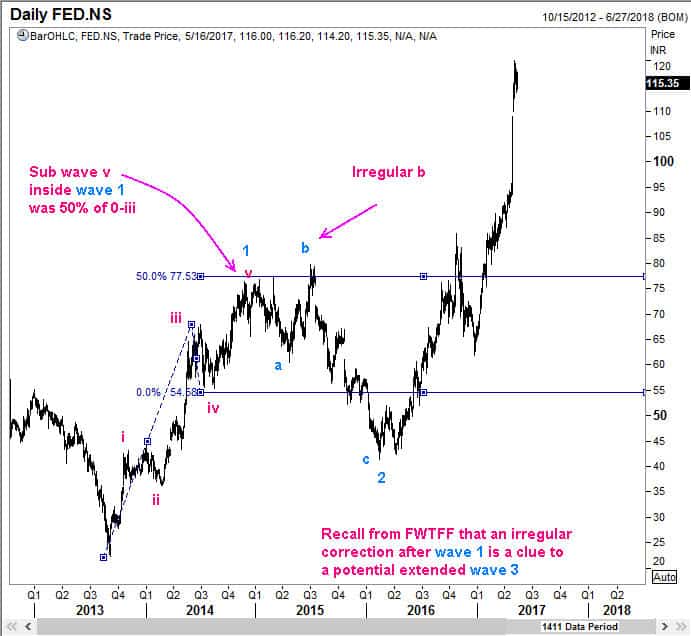
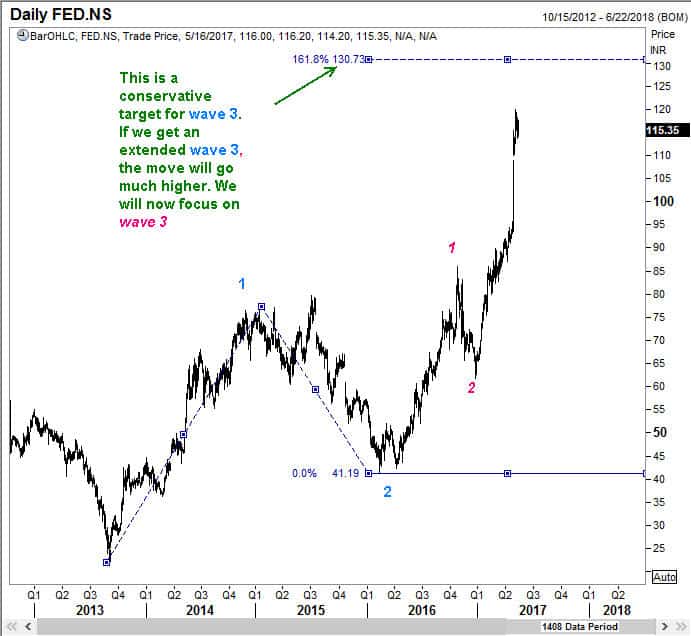
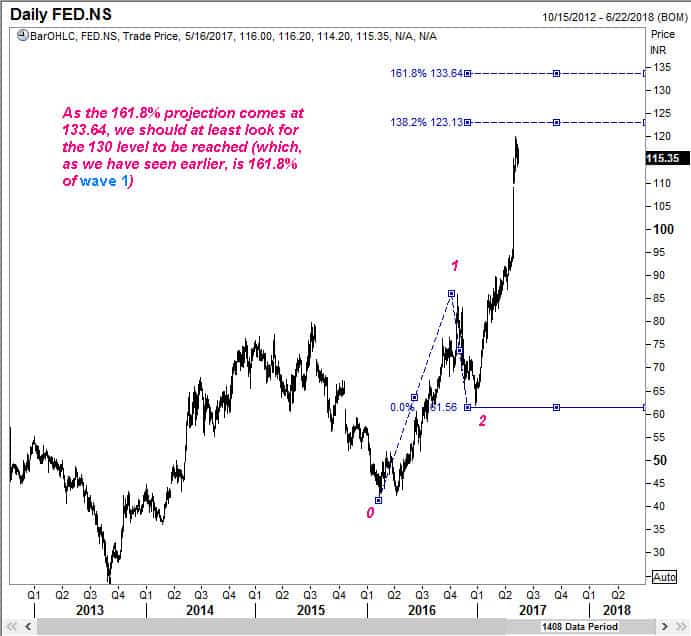
Take a look at the first set of charts that are shared for your benefit. Pay attention to the color code for each wave. That will help you follow my reasoning. The colors are maintained at each level.
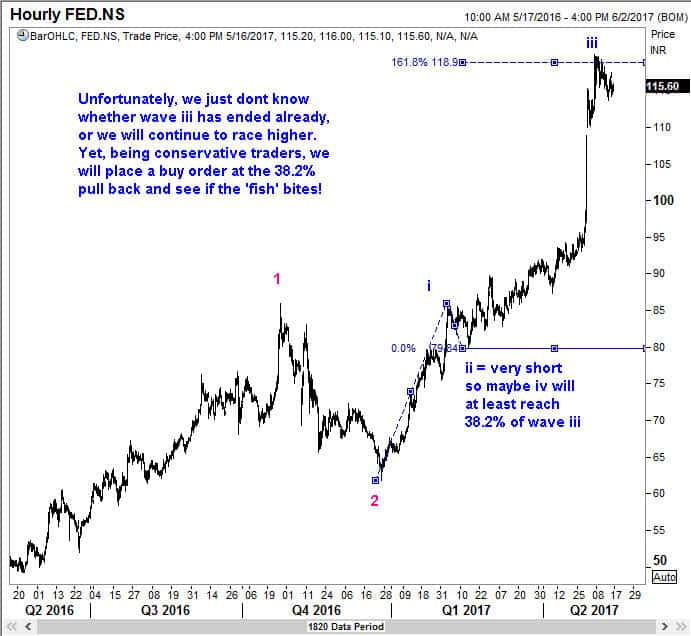
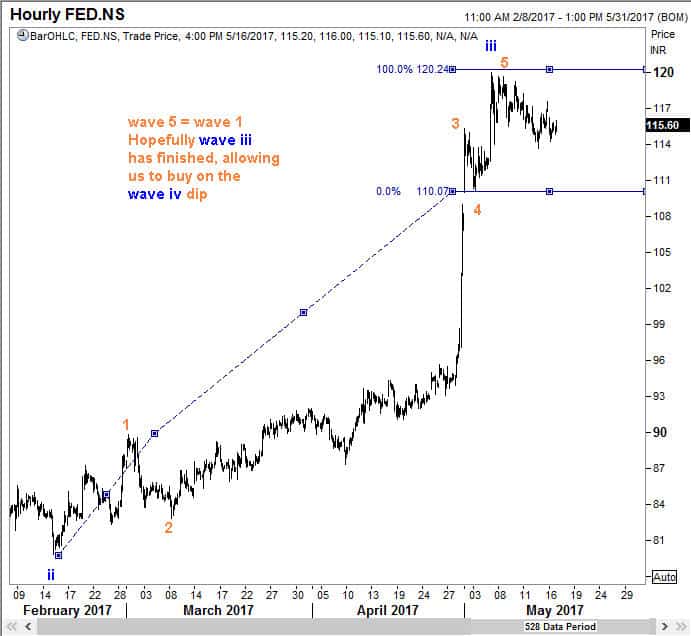
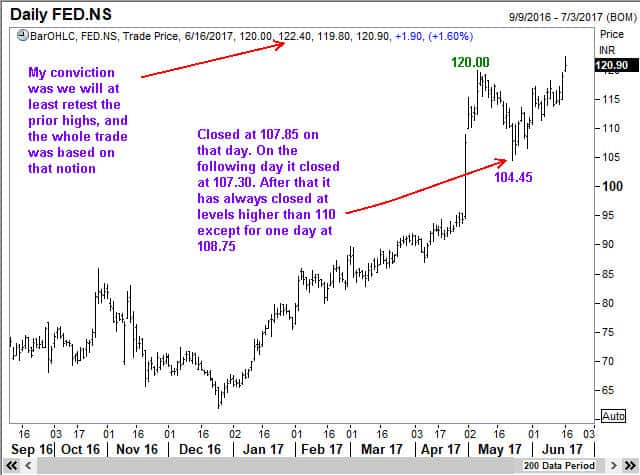
The above analyses laid out the foundation for the trade. The strategy was clearly laid out. We knew in advance where in the cycle the stock was trading. We also decided where to buy. In subsequent updates, we bought some at 112.50 and 107.80. The stock traded between 107.80 and 114 several times, giving members the opportunity to go in and out, if they chose to. But then came a time when it finally broke down and went all the way down to 104.45. Normally, most traders would want out when such a move happens. But we were ready. After all, the case for this dip was made out on the very day!
The stock has so far made a high of 122.40, which is 13% from 107.80 and 17% from 104.60. You too can make such returns by following a systematic approach to the markets.