• About
  • Elliott Waves
    • Elliott Waves Explained
    • Elliott Wave Magic Illustrated with Wave Charts
    • Elliott Wave Edge – How Elliott Wave Traders Win
    • Fibonacci Number Series and Elliott Waves
    • How to use Fibonacci Ratio Retracements
    • Elliott Wave Books
      • The Elliott Wave Book – Five Waves to Financial Freedom
      • Dividend Growth Investing Using Elliott Waves
    • Videos
  • Equities
    • Indices
      • Africa
        • Egypt
      • Australia
      • European Indices
        • AEX – Index, Amsterdam
        • DAX Index
        • Istanbul
        • Russia
        • Spain’s IBEX 35
      • Asian Indices
        • India
        • China
        • Dubai
        • Kuwait
        • Kuala Lumpur
        • Pakistan
        • Saudi
        • Taiwan
      • US Indices
        • S&P500
        • Nasdaq
        • Dow Jones
        • Dow Jones Utilities
    • Stocks
      • Asian Stocks
        • Indian Stocks Trading
        • Dubai Stocks Outlook
        • Japanese Stocks
        • Kuwait stocks
        • Saudi Stocks Outlook
      • African Stocks
        • Egyptian Stocks
      • Swiss Stocks
      • Australian Stocks
      • European Stocks
      • US Stocks outlook
      • UK Stocks
  • Commodities
    • Copper
    • Gasoline
    • Gold
    • Natural Gas
    • Oil
    • Palm Oil
    • Raw Sugar
    • Rubber
    • Soybean Oil
    • Silver
  • Forex
    • AUD
    • Bitcoin
    • CAD
    • CHF
    • Euro
    • GBP
    • INR
    • NZD
    • JPY
  • Raves
  • Consulting
    • Consulting
  • Ramki’s Watchlist
Top News

Has Meta (Facebook) stock seen the bottom

March 21, 2022

What Is The Nearest Technical Support For Meta (NASDAQ: FB)

February 7, 2022

Using Elliott Waves to Capture a Trade in S&P500

January 27, 2022
Facebook Twitter Instagram
WaveTimes Blog WaveTimes Blog
Wave times
  • About
  • Elliott Waves
    • Elliott Waves Explained
    • Elliott Wave Magic Illustrated with Wave Charts
    • Elliott Wave Edge – How Elliott Wave Traders Win
    • Fibonacci Number Series and Elliott Waves
    • How to use Fibonacci Ratio Retracements
    • Elliott Wave Books
      • The Elliott Wave Book – Five Waves to Financial Freedom
      • Dividend Growth Investing Using Elliott Waves
    • Videos
  • Equities
    • Indices
      • Africa
        • Egypt
      • Australia
      • European Indices
        • AEX – Index, Amsterdam
        • DAX Index
        • Istanbul
        • Russia
        • Spain’s IBEX 35
      • Asian Indices
        • India
        • China
        • Dubai
        • Kuwait
        • Kuala Lumpur
        • Pakistan
        • Saudi
        • Taiwan
      • US Indices
        • S&P500
        • Nasdaq
        • Dow Jones
        • Dow Jones Utilities
    • Stocks
      • Asian Stocks
        • Indian Stocks Trading
        • Dubai Stocks Outlook
        • Japanese Stocks
        • Kuwait stocks
        • Saudi Stocks Outlook
      • African Stocks
        • Egyptian Stocks
      • Swiss Stocks
      • Australian Stocks
      • European Stocks
      • US Stocks outlook
      • UK Stocks
  • Commodities
    • Copper
    • Gasoline
    • Gold
    • Natural Gas
    • Oil
    • Palm Oil
    • Raw Sugar
    • Rubber
    • Soybean Oil
    • Silver
  • Forex
    • AUD
    • Bitcoin
    • CAD
    • CHF
    • Euro
    • GBP
    • INR
    • NZD
    • JPY
  • Raves
  • Consulting
    • Consulting
  • Ramki’s Watchlist
WaveTimes Blog WaveTimes Blog
Home » Why Elliott Wave analysis is useful – Part 1
Trading Tips

Why Elliott Wave analysis is useful – Part 1

RamkiBy RamkiApril 30, 20092 Comments2 Mins Read
Facebook Twitter LinkedIn Telegram Pinterest Tumblr Reddit WhatsApp Email
Share
Facebook Twitter LinkedIn Pinterest Email

I use Elliott Wave analysis to give me an idea of where we are in an unfolding move, and also how far that move could go. If there is one important lesson I have learnt in using Wave Analysis, it is this: Your analysis could be the best in the world, but until the move happens, you are no better than anyone else out there. In other words, the best use you could put your analysis is to take the trade that is suggested, but be sure to have stops in place. If it works out, then you are a hero, because you got in at the best possible levels, and managed to stick with the move for longer than most others. If you get stopped, well, you paid a smaller price than most others. Elliott waves in kuwait index
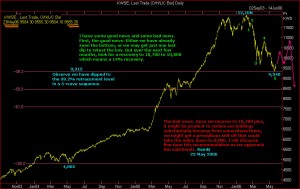
I would like you to consider the attached chart carefully. SNP500-3-apr-08. I had written this on 3rd April 2008 when the S&P was at 1367. This is a weekly chart (which is why the date on the chart shows the last day of the week). If you go to Yahoo-Finance and look up the daily chart of S&P today, you will observe that after spiking for one day to 1440 on 19th May, the index was sold down to 1201 on 15th July. Then we staged a recovery to 1312 on 8th November. From there, we have reached a low of 1097 till date. The objective mentioned on my analysis was 1060, just a few points away. Will we see a strong recovery from 1060 area? A bounce back to around 1110 is likely, but it is still too soon to think of buying. Be patient.KSE index analysis
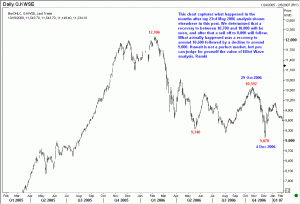
examples wave
Share. Facebook Twitter Pinterest LinkedIn Tumblr Telegram Email
Previous ArticleWhy Elliott Wave analysis is useful – Part 2
Next Article Elliott Wave Analysis of Forex
Ramki
  • Website

Related Posts

One-Hour Conversation with Ramki – A sample

February 10, 2021

What kind of trader are you?

October 1, 2016

Elliott Wave Analysis of Raytheon Co

February 5, 2013
View 2 Comments

2 Comments

  1. rajni on August 23, 2012 5:07 pm

    Ram Ram,

    Ramki Ji , I find ur website matter very valuable. i want to be a good trader. I studied elliott wave. but sometimes i find myself in very confusion. I m simple housewife , may u show me or guidelines so that it make it simpler for me. I m trying to get ur book to read. In ur name there is Lord Ram. I firmly believe that u will help me to find my way.

    Regards

    Rajni

    Reply
    • Ramki Ramakrishnan on August 24, 2012 2:49 pm

      Rajni Ji, Thank you for writing. Please read my book carefully. It is written in an easy to follow English. Then go through the various examples in this blog. Your understanding will greatly improve and you will become a much better trader and investor. Good luck.

      Reply

Leave A Reply Cancel Reply

Recent Posts
  • Has Meta (Facebook) stock seen the bottom
  • What Is The Nearest Technical Support For Meta (NASDAQ: FB)
  • Using Elliott Waves to Capture a Trade in S&P500
  • Hedge Funds and Elliott Waves – Netflix $NFLX
  • When Elliott Waves applauds the promoter’s signals!

WaveTimes is a Research Organization dedicated to providing original analysis, reports, reviews, and insights on developments in mutual funds, stocks, investing, foreign exchange, commodities, and bonds.

Contact WaveTimes

L-601 Mantri Espana,

Kariyammana Agrahara, Bellandur, Bangalore 560103

Follow Us

  • Facebook
  • YouTube
  • Twitter

© 2022 Wave Times. All Rights Reserved.
  • About
  • Books
  • Privacy Policy
  • Policies and Standards

Type above and press Enter to search. Press Esc to cancel.