• About
  • Elliott Waves
    • Elliott Waves Explained
    • Elliott Wave Magic Illustrated with Wave Charts
    • Elliott Wave Edge – How Elliott Wave Traders Win
    • Fibonacci Number Series and Elliott Waves
    • How to use Fibonacci Ratio Retracements
    • Elliott Wave Books
      • The Elliott Wave Book – Five Waves to Financial Freedom
      • Dividend Growth Investing Using Elliott Waves
    • Videos
  • Equities
    • Indices
      • Africa
        • Egypt
      • Australia
      • European Indices
        • AEX – Index, Amsterdam
        • DAX Index
        • Istanbul
        • Russia
        • Spain’s IBEX 35
      • Asian Indices
        • India
        • China
        • Dubai
        • Kuwait
        • Kuala Lumpur
        • Pakistan
        • Saudi
        • Taiwan
      • US Indices
        • S&P500
        • Nasdaq
        • Dow Jones
        • Dow Jones Utilities
    • Stocks
      • Asian Stocks
        • Indian Stocks Trading
        • Dubai Stocks Outlook
        • Japanese Stocks
        • Kuwait stocks
        • Saudi Stocks Outlook
      • African Stocks
        • Egyptian Stocks
      • Swiss Stocks
      • Australian Stocks
      • European Stocks
      • US Stocks outlook
      • UK Stocks
  • Commodities
    • Copper
    • Gasoline
    • Gold
    • Natural Gas
    • Oil
    • Palm Oil
    • Raw Sugar
    • Rubber
    • Soybean Oil
    • Silver
  • Forex
    • AUD
    • Bitcoin
    • CAD
    • CHF
    • Euro
    • GBP
    • INR
    • NZD
    • JPY
  • Raves
  • Consulting
    • Consulting
  • Ramki’s Watchlist
Top News

Has Meta (Facebook) stock seen the bottom

March 21, 2022

What Is The Nearest Technical Support For Meta (NASDAQ: FB)

February 7, 2022

Using Elliott Waves to Capture a Trade in S&P500

January 27, 2022
Facebook Twitter Instagram
WaveTimes Blog WaveTimes Blog
Wave times
  • About
  • Elliott Waves
    • Elliott Waves Explained
    • Elliott Wave Magic Illustrated with Wave Charts
    • Elliott Wave Edge – How Elliott Wave Traders Win
    • Fibonacci Number Series and Elliott Waves
    • How to use Fibonacci Ratio Retracements
    • Elliott Wave Books
      • The Elliott Wave Book – Five Waves to Financial Freedom
      • Dividend Growth Investing Using Elliott Waves
    • Videos
  • Equities
    • Indices
      • Africa
        • Egypt
      • Australia
      • European Indices
        • AEX – Index, Amsterdam
        • DAX Index
        • Istanbul
        • Russia
        • Spain’s IBEX 35
      • Asian Indices
        • India
        • China
        • Dubai
        • Kuwait
        • Kuala Lumpur
        • Pakistan
        • Saudi
        • Taiwan
      • US Indices
        • S&P500
        • Nasdaq
        • Dow Jones
        • Dow Jones Utilities
    • Stocks
      • Asian Stocks
        • Indian Stocks Trading
        • Dubai Stocks Outlook
        • Japanese Stocks
        • Kuwait stocks
        • Saudi Stocks Outlook
      • African Stocks
        • Egyptian Stocks
      • Swiss Stocks
      • Australian Stocks
      • European Stocks
      • US Stocks outlook
      • UK Stocks
  • Commodities
    • Copper
    • Gasoline
    • Gold
    • Natural Gas
    • Oil
    • Palm Oil
    • Raw Sugar
    • Rubber
    • Soybean Oil
    • Silver
  • Forex
    • AUD
    • Bitcoin
    • CAD
    • CHF
    • Euro
    • GBP
    • INR
    • NZD
    • JPY
  • Raves
  • Consulting
    • Consulting
  • Ramki’s Watchlist
WaveTimes Blog WaveTimes Blog
Home » What is the outlook for SNP500
S&P500

What is the outlook for SNP500

RamkiBy RamkiNovember 3, 20085 Comments2 Mins Read
Facebook Twitter LinkedIn Telegram Pinterest Tumblr Reddit WhatsApp Email
Share
Facebook Twitter LinkedIn Pinterest Email

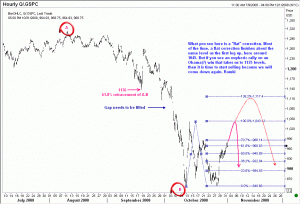
What is the outlook for S&P500 once we get the US Presidential Election results? This is the question that most traders of US stocks and options have in their mind. Let me start with the assertion that we are still in a bear trend in the big picture. Bear market rallies are common, and often take us up by 25% or more. But inevitably, the trend will reassert itself, and we will be back on our way down. So use this rally to get out of those stocks which you might have bought too soon, and wait for better levels to buy them back. As for sell-levels, well, I think 1045 should be a decent level to get out, but if we get to 1136 levels, I might even think of turning short on some weak stocks! To sum up, don’t overstay this rally in the SNP500 beyond 1136. Actually you should watch what happens at 1045 and run for cover if we start coming off from there. 

Related S&P500 links:

Was that the stock market bottom?
SNP500 revisited
S&P500 and Citi

Fifth wave extensions can make you rich!

What is a significant rally in the stock markets?

Harmony in markets: S&P500

S&P 500: Potential Ending Diagonal Triangle

Ending Diagonal Triangle in S&P500?

S&P500 Elliott Wave update

S&P500 index: is a top already in?

S&P 500 update: where is the top?

S&P500 continues its rally

S&P500 remains resilient

S&P500 ready to dive?

S&P500 Update: May 19, 2009

S&P500 Elliott Wave update:21 May 2009

S&P 500 breaks higher: update 2 June 2009


Share. Facebook Twitter Pinterest LinkedIn Tumblr Telegram Email
Previous ArticleShould we buy Reliance Industries now?
Next Article Should I sell Citi?
Ramki
  • Website

Related Posts

Using Elliott Waves to Capture a Trade in S&P500

January 27, 2022

SNP 500 Index in sideways move

November 7, 2020

A quick update on the S&P500 index

April 3, 2013
View 5 Comments

5 Comments

  1. Tony on November 9, 2008 10:32 pm

    It’s now November 9: was that the election rally already? On the S&P 500 we have seen a mini-top at 1000 which is no where near the 25% retracement that you and most of us have expected.

    Also, do I see a reverse head-and-shoulders formation with the top of the upside-down head at 850?

    Reply
  2. Ramki on November 10, 2008 11:13 am

    Hello Tony, Thanks for your comment. While bear market rallies ‘often’ see a 25% recovery, we should always be on the guard for a quick return to the trend. As for the reverse head-and-shoulder formation, you will see in the hourly charts a double bottom at the same level(which means the left shoulder and head are at the same level and hence negates the formation). Should it test and break that level, then it will normally carry some distance on the downside. Also, my experience with reverse HNS is we should wait for the neck-line to break before confirming it is one, and look to trade on the succeeding dip back to the neckline. Best.Ramki

    Reply
  3. Allison Essert on November 10, 2008 1:19 pm

    Tony, we got an 18% gain and that I think is quite something in these troubled times!

    Reply
  4. Pingback: SNP500 revisited : Trade with Ramki

  5. David on December 7, 2008 6:09 am

    Amazing stuff ! Thats how i see Elliot wave whats not so easy is its mastery. I am reading through your old posts to see what actually happened and the results are formidable.

    Reply

Leave A Reply Cancel Reply

Recent Posts
  • Has Meta (Facebook) stock seen the bottom
  • What Is The Nearest Technical Support For Meta (NASDAQ: FB)
  • Using Elliott Waves to Capture a Trade in S&P500
  • Hedge Funds and Elliott Waves – Netflix $NFLX
  • When Elliott Waves applauds the promoter’s signals!

WaveTimes is a Research Organization dedicated to providing original analysis, reports, reviews, and insights on developments in mutual funds, stocks, investing, foreign exchange, commodities, and bonds.

Contact WaveTimes

L-601 Mantri Espana,

Kariyammana Agrahara, Bellandur, Bangalore 560103

Follow Us

  • Facebook
  • YouTube
  • Twitter

© 2022 Wave Times. All Rights Reserved.
  • About
  • Books
  • Privacy Policy
  • Policies and Standards

Type above and press Enter to search. Press Esc to cancel.