 For new comers to the show, the magic of Elliott Wave Analysis is fascinating. The experienced players, they know that nothing works like Elliott Wave Analysis. If you wish to change the way you trade, and take low risk positions, then you have come to the right spot.
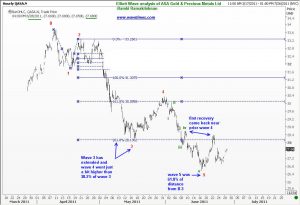
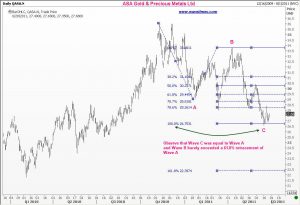
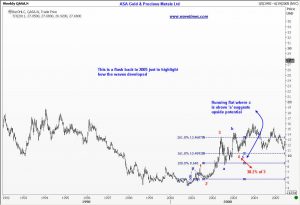
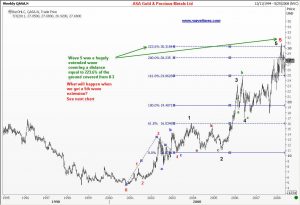
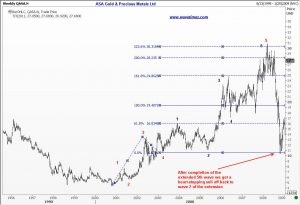
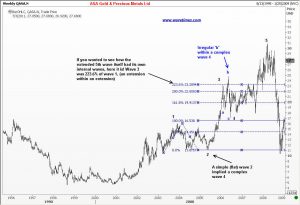
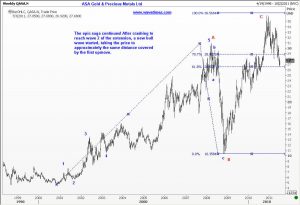
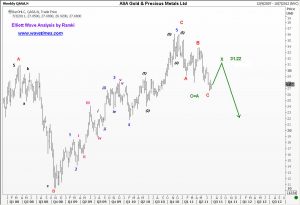
Today, I wish to share with you a bunch of charts I prepared for a dear friend, Bob, a couple of days back. Quite truthfully, I have never heard of this ticker before that. ASA Gold and Precious Metals is a closed fund. Look at each chart and the comments carefully. See how at every turn the Wave Principle was respected. It is possible for you to apply these methods to just about any instrument, whether it is stock, commodity, futures or forex. There are hundred of examples elsewhere in Wavetimes that you can browse at your own pace and see the endlsess possibilities if you incorporate Elliott Wave Analysis in your trading. Enjoy, and share.
The charts on the right go down from the latest hourly charts to the weekly charts. I have also indicated towards the end how I think the next big moves will unfold. Feel free to comment. For those on Twitter, this is a great opportunity to introduce your friends to Wavetimes. Look at the Raves section on top, and you will see the kind of people who have been following these comments for the last 20 plus years.

