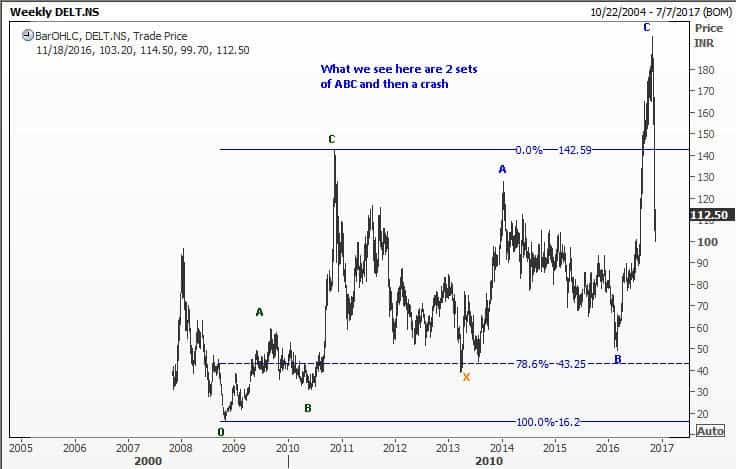
Anyone who trades in the Indian Stock market would have heard of Mr Rakesh Jhunjhunwala and how he made his vast fortune. But Economic Times has run a story this morning about how he has lost $200 million in about 2 weeks. And a few minutes back, I read the news that he has upped his stake in Delta Corp, a company which has lost 40% of its value following the demonetization of large value Indian currency notes. His average price of purchase today was at 106.54. Now readers of WaveTimes are smart people! You already know that if one has conviction in a business, then any sell-off should be used as a great opportunity to buy some more of that business. That is precisely what Mr Jhunjhunwala is doing. But what is interesting to readers of WaveTimes is not just the news, but the levels he has chosen to buy.
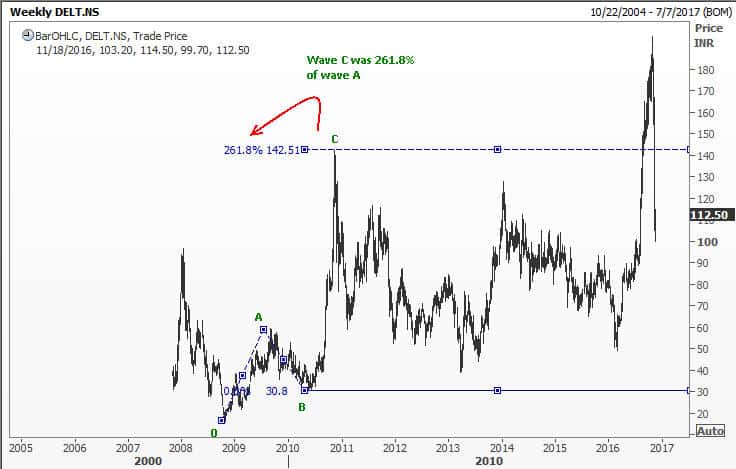
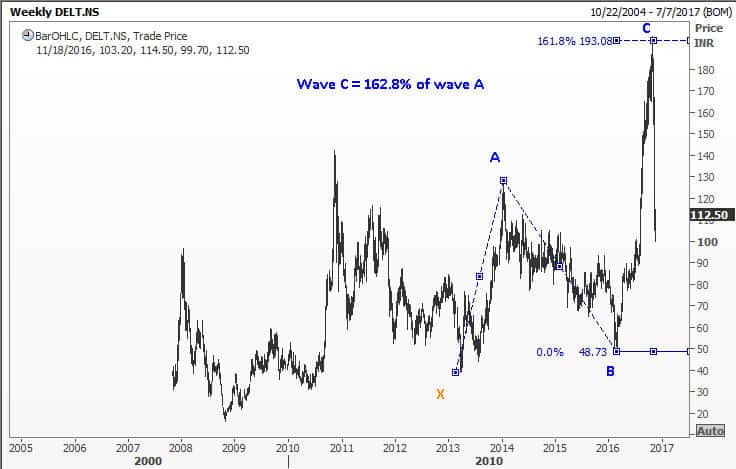
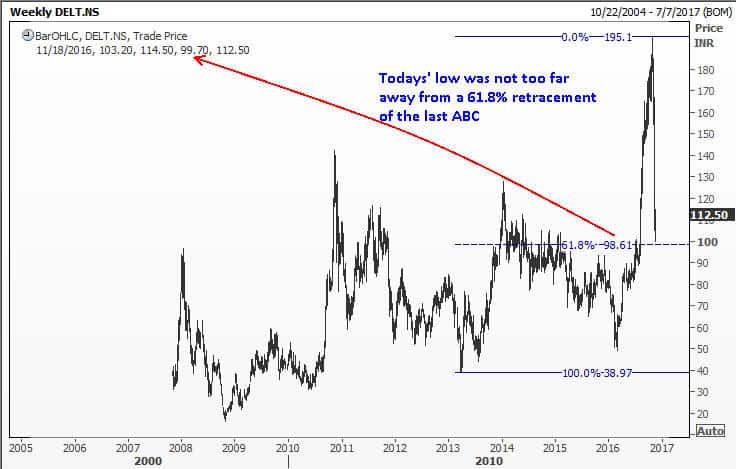
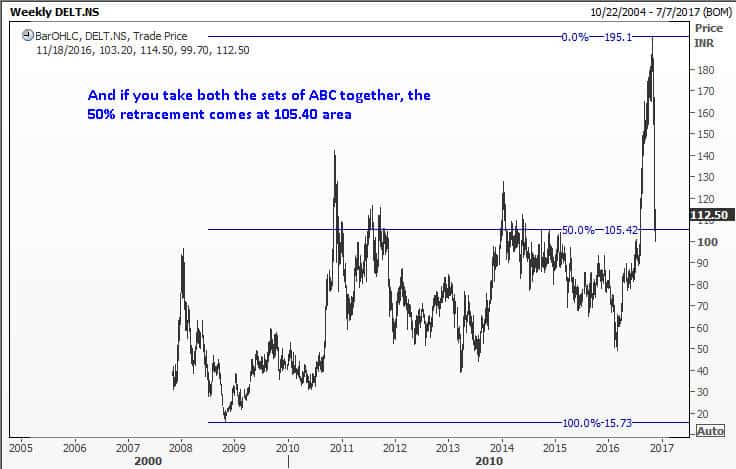
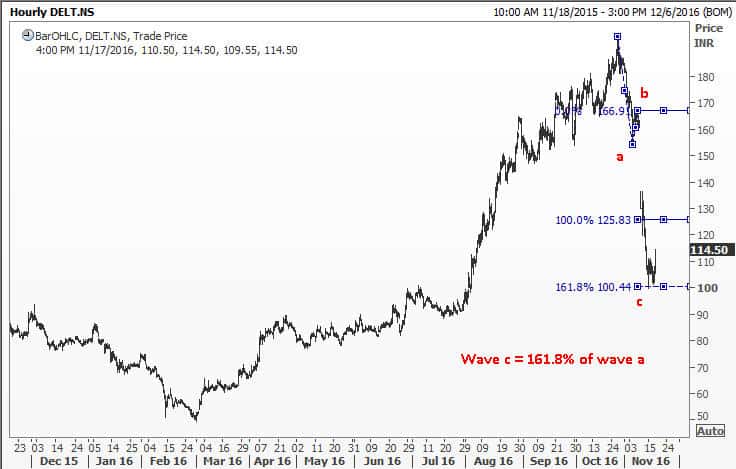
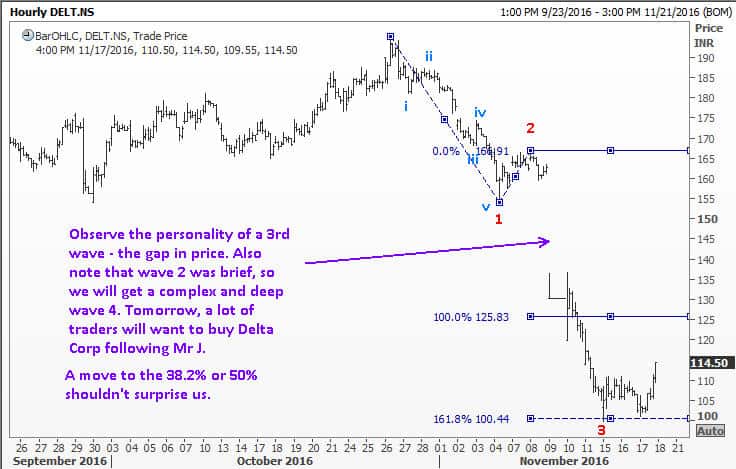
Let us take a look at the charts of Delta Corp. You will see that he has chosen to buy near the 61.8% retracement. Naturally, when you place a big trade, you can’t get it all at the lowest price. So you pitch it slightly above that level. Hence his average is slightly higher. But the price has closed at 114 plus levels. Also, it is important to bear in mind the tactics of big traders. They often buy at the end of a third wave, not wanting to wait for the end of the fifth wave. Trades done at the end of wave 5 will produce a longer reaction, and all they need to do is to help that turn by nudging the market a bit there. The real buying would have happened at the end of the third wave.
Be sure to read the small note at the end of these charts. (Tip: You should open all the charts immediately in separate tabs, or you will have to keep going back-and-forth)
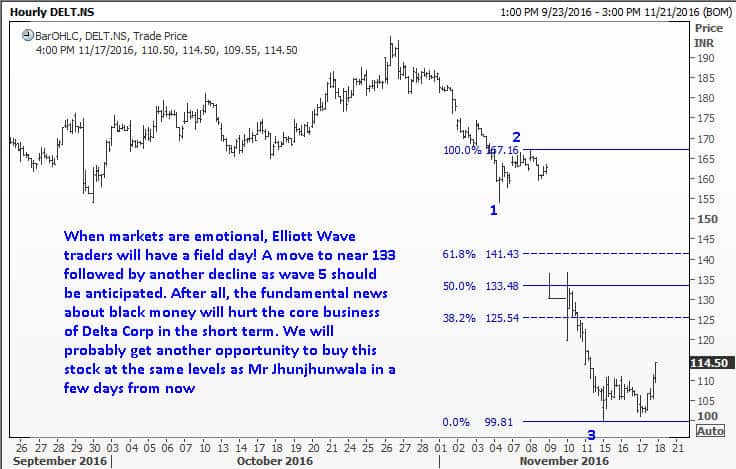
Now that you have admired the charts and wondered about the tactics of Mr Jhunjhunwala, you might have paused to think about my wave count. If I label this as a 5-wave down move, won’t we get another 5 wave move down after a pull back? After all, corrections should be 3-wave affairs. That would be a great question, and if you ask that in the comment, I will answer it there!
10 Comments
This is the question that had been nagging me since GDX (gold miners)also had a five wave down. I feel it is a pullback with another 5 wave down move left after pullback but everyone is telling it is in a bull market. So I really want to know ” If you label this as a 5-wave down move, won’t we get another 5 wave move down after a pull back? After all, corrections should be 3-wave affairs.”
Amit/ Sam and others, You need to understand that all wave counts are tentative. They are an exercise in probability. Unless you are going to invest some money and not look at it again for a few years, you will always have the opportunity to re-assess. From that point of view, your current obsession should be less with whether we will end the downmove as a wave 5 (which has bearish implications) or as a minor wave 5 of a C wave (instead of 1/2/3 it will be a/b/c). Rather it should be with deciding your position size to BUY on the next dip and worry about the wave count later on. (Of course, if you are in the business of making market ‘calls’ you will be worried about whatever you write! That is a different story. But if you are a trader or investor, you know that the time to buy is approaching, even if the exposure should be initially small. Figure out the possible end points for wave 5 using the methods described in my book Five waves to Financial Freedom, and then tread softly into the stock. You should be fine!
Hi Mr Ramki,
If your x-wave count is correct, it should be either wave 4 of a five wave move down, or wave B where the previous abc from top complete wave A of correction. For both cases, a new low should be expected.
I also see wave x (of WXY) in your count is seems a bit too large. Is that normal in your experience? Thanks for your teaching in advance.
Sir,
Thanks for your brief post.
I think as per your charts one can enter Delta corp after completion of wave 5 around 92-95.
Am i right. Please correct if i am wrong.
What is the view about the same company (in BSE traded data), since we get long history?
Dear Sir,
Can I request you to please look at Nifty chart which is giving some confusion as there are many news flowing.
Hi Piyush, As members of my premium service are being shown the Nifty analysis, I am unable to present that on the free blog. Sorry.
Mr. Ramakrishnan please indicate the impulse move in your charts. Without that the ABC move does not have reference point.
Simant, In this particular post the idea was to teach people that even when one is attempting to follow on the coat tails of big investors, he/she can have an edge that Elliott Waves would offer.
HI Ramki,
Great to see another very interesting article.
All the best