If you are a market savvy investor or trader, and especially if you are an institutional player, you are probably familiar with SBND, which is the ticker name for DB 3X Short 25 Year Treasury Bond ETN
(NYSEARCA:SBND). This post about how to use Elliott Wave analysis to “time” your exposure to this ETN will be of considerable interest to you. (For the others, briefly, the index to which this ETN is linked measures the performance of investments in Ultra T-Bond Futures contracts traded on the CBOT whose underlying assets are U.S. Treasury Bonds with a remaining term to maturity of not less than 25 years from the first day of the futures contract delivery month.
The principal advantage of SBND are four fold. First, you gain a leveraged exposure , 3x actually! Second, you gain exposure to a short bet on the futures (which means you are betting interest rates will rise) by going long on the ETN. Some institutions can only go long). Third, SBND is structured as an exchange-traded note (ETN), meaning that they are senior unsubordinated debt instruments issued by a bank; ETNs generally exhibit lower tracking error, but do expose investors to the credit risk of the issuing institution (in this case, Deutsche Bank). Finally, because the SBND ETN compounds only 12 times per year, it will be less susceptible to both an erosion of returns in choppy markets and an enhancement of returns in trending markets. Let us now turn to the main story of this post, how to use Elliott Waves to get a better entry to the market.
The first Elliott Wave chart of SBND shown below is a weekly chart that goes back to 2010. You can see that from a high of around 30, the ETN has collapsed to 3.41. Remember, this is a leveraged bet, and the move is amplified when the 25 year (+) T Bonds respond to interest rate expectations. Now even with an untrained eye, one is able to make out that we are in the fifth wave of the sell-off. Elliott Wave theory states that when a five wave move ends, we should expect a significant correction of that move. So, if we believe that US interest rates will rally, and T Bonds will weaken, then a short position will be the right way to trade. Buying SBND will give us a leveraged bet is that direction. So let us begin the analysis. I suggest that you open each chart in a new tab so you can see it clearly.
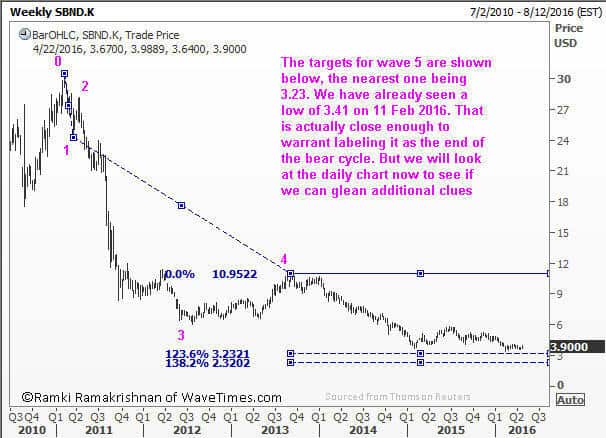
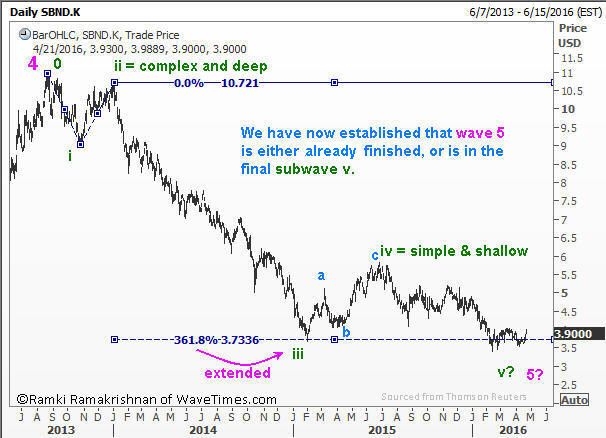
In my Elliott Wave book, ‘Five Waves to Financial Freedom‘, I have explained how to identify the possible end points for a fifth wave. The above chart shows that 3.23 is one such target. We have already seen a low of 3.41. and given the scale of the down move, these few points are within the scope of market noise. But we will validate our count by looking closer at the components of the fifth wave. Elliott Wave principle says that each impulse wave is made up of five smaller waves. The following chart shows the Fibonacci Ratio relationships of some of the sub waves, and the color-coded notations will help you better understand my analysis. Observe that I have placed a question mark after the pink-colored wave 5, wondering whether the 3.41 low has fulfilled the measurement criteria that I use to help validate the analysis.
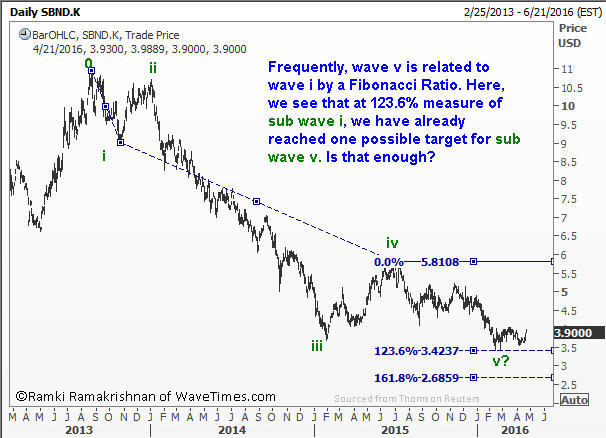
Just like in the first chart, I am going to present you with the Fibonacci ratio measurement for subwave 5 in the following chart. You can see that subwave 5 finished almost precisely at the 123.6% measure of subwave 1!
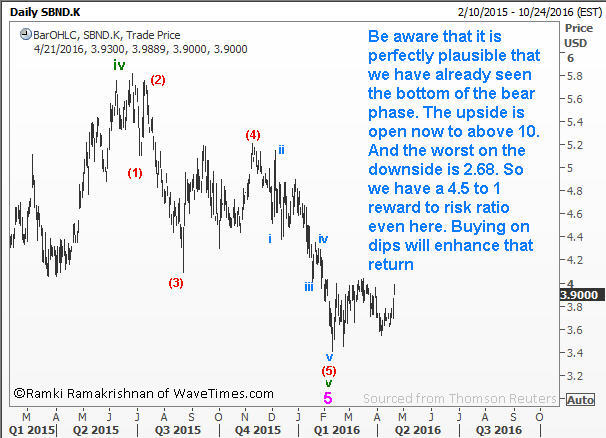
When it comes to risking money, it makes immense sense to be aware of alternate targets. After all, one will be silly to be presumptuous about market turn levels. These other levels are shown below.
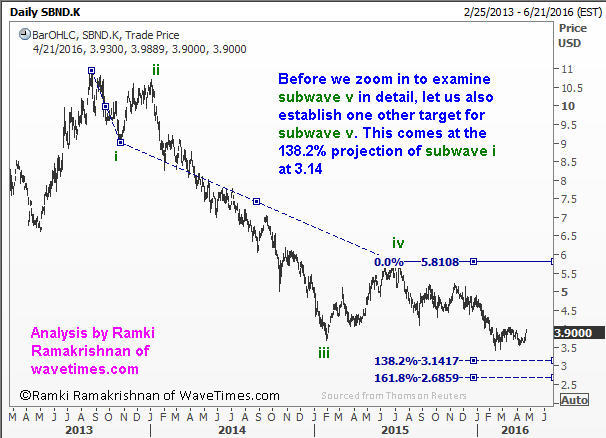
So we have established that either the bottom is already in place, or at worst we will get a dip to around 2.68. Now comes the decision point, the time to determine our tactics. First of all, we need to know how much profits are available on this trade. When a five wave move is completed, the ensuing reversal will usually take the price to the prior fourth wave level in the same degree. If you look back at the first chart above, you will see that the pink colored wave 4 falls around the 10 level. So that is the medium term target. Of course, it is not going to be a straight line move. That is not the way how financial markets behave. Indeed, the subwave iv (green color) will offer some good resistance (and trading opportunity) as we gradually make our way higher. But knowing that we will visit the 10 level in the next few years is itself an edge.
Now that we have established the risk-reward trade off, and also the maximum adverse downside, we can think about how to structure our exposure. Remember I mentioned the possibility that we could still go down to 2.68? Well, that will happen if we are currently only in minor wave 4 within the fifth wave. The general market is not keeping a tab of these wave counts, but the crowd psychology will cause a setback when we reach either the 38.2% or 50% retracement of the wave 3 shown below. A medium term investor will use that setback to start building his position.
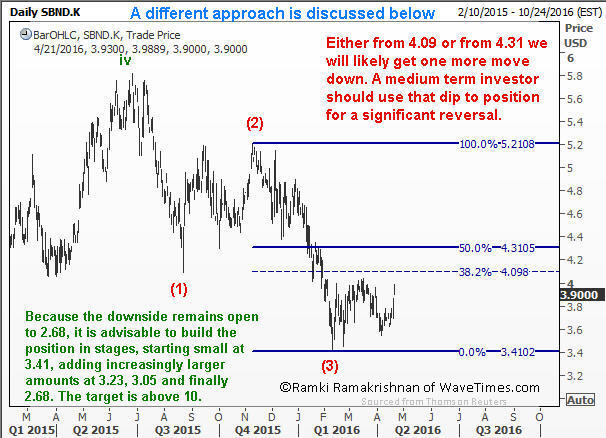
The above discussion is a technical approach to building a position in an ETN that offers a leveraged exposure to the Long Term US Treasury Bond market on the short side. Elliott Wave Analysis works very well in any freely traded market that is liquid.And the same holds good for this ETN as well.
