• About
  • Elliott Waves
    • Elliott Waves Explained
    • Elliott Wave Magic Illustrated with Wave Charts
    • Elliott Wave Edge – How Elliott Wave Traders Win
    • Fibonacci Number Series and Elliott Waves
    • How to use Fibonacci Ratio Retracements
    • Elliott Wave Books
      • The Elliott Wave Book – Five Waves to Financial Freedom
      • Dividend Growth Investing Using Elliott Waves
    • Videos
  • Equities
    • Indices
      • Africa
        • Egypt
      • Australia
      • European Indices
        • AEX – Index, Amsterdam
        • DAX Index
        • Istanbul
        • Russia
        • Spain’s IBEX 35
      • Asian Indices
        • India
        • China
        • Dubai
        • Kuwait
        • Kuala Lumpur
        • Pakistan
        • Saudi
        • Taiwan
      • US Indices
        • S&P500
        • Nasdaq
        • Dow Jones
        • Dow Jones Utilities
    • Stocks
      • Asian Stocks
        • Indian Stocks Trading
        • Dubai Stocks Outlook
        • Japanese Stocks
        • Kuwait stocks
        • Saudi Stocks Outlook
      • African Stocks
        • Egyptian Stocks
      • Swiss Stocks
      • Australian Stocks
      • European Stocks
      • US Stocks outlook
      • UK Stocks
  • Commodities
    • Copper
    • Gasoline
    • Gold
    • Natural Gas
    • Oil
    • Palm Oil
    • Raw Sugar
    • Rubber
    • Soybean Oil
    • Silver
  • Forex
    • AUD
    • Bitcoin
    • CAD
    • CHF
    • Euro
    • GBP
    • INR
    • NZD
    • JPY
  • Raves
  • Consulting
    • Consulting
  • Ramki’s Watchlist
Top News

Has Meta (Facebook) stock seen the bottom

March 21, 2022

What Is The Nearest Technical Support For Meta (NASDAQ: FB)

February 7, 2022

Using Elliott Waves to Capture a Trade in S&P500

January 27, 2022
Facebook Twitter Instagram
WaveTimes Blog WaveTimes Blog
Wave times
  • About
  • Elliott Waves
    • Elliott Waves Explained
    • Elliott Wave Magic Illustrated with Wave Charts
    • Elliott Wave Edge – How Elliott Wave Traders Win
    • Fibonacci Number Series and Elliott Waves
    • How to use Fibonacci Ratio Retracements
    • Elliott Wave Books
      • The Elliott Wave Book – Five Waves to Financial Freedom
      • Dividend Growth Investing Using Elliott Waves
    • Videos
  • Equities
    • Indices
      • Africa
        • Egypt
      • Australia
      • European Indices
        • AEX – Index, Amsterdam
        • DAX Index
        • Istanbul
        • Russia
        • Spain’s IBEX 35
      • Asian Indices
        • India
        • China
        • Dubai
        • Kuwait
        • Kuala Lumpur
        • Pakistan
        • Saudi
        • Taiwan
      • US Indices
        • S&P500
        • Nasdaq
        • Dow Jones
        • Dow Jones Utilities
    • Stocks
      • Asian Stocks
        • Indian Stocks Trading
        • Dubai Stocks Outlook
        • Japanese Stocks
        • Kuwait stocks
        • Saudi Stocks Outlook
      • African Stocks
        • Egyptian Stocks
      • Swiss Stocks
      • Australian Stocks
      • European Stocks
      • US Stocks outlook
      • UK Stocks
  • Commodities
    • Copper
    • Gasoline
    • Gold
    • Natural Gas
    • Oil
    • Palm Oil
    • Raw Sugar
    • Rubber
    • Soybean Oil
    • Silver
  • Forex
    • AUD
    • Bitcoin
    • CAD
    • CHF
    • Euro
    • GBP
    • INR
    • NZD
    • JPY
  • Raves
  • Consulting
    • Consulting
  • Ramki’s Watchlist
WaveTimes Blog WaveTimes Blog
Home » Using Elliott Waves to Capture a Trade in S&P500
S&P500

Using Elliott Waves to Capture a Trade in S&P500

A 3% gain in S&P500 using Elliott Waves
RamkiBy RamkiJanuary 27, 2022No Comments2 Mins Read
Facebook Twitter LinkedIn Telegram Pinterest Tumblr Reddit WhatsApp Email
Share
Facebook Twitter LinkedIn Pinterest Email

Elliott Waves enabled us to capture a nice little trade in S&P500 index in the last few days. On the 23rd of January, 2022, I emailed members of the WaveTimes exclusive club the following message “With the markets all jittery about the likely interest rate hikes this year in the US, everyone knows that stocks are going lower. One exception could be value stocks! But this email is about the S&P50 index. How far can this go, and how should we trade it from here? As you all know, my approach has got less to do with forecasting than finding a low-risk entry point, where the rewards give us outsized returns. With this in mind, I have prepared a set of charts that you can have…” In case you didn’t know, the exclusive club of WaveTimes seeks to educate experienced traders who undertand market risks about how to capture alpha using Elliott Waves. (It is not a service that offers investment advice, by the way).  Many members wrote back immediately asking for the analysis, and I reproduce some of the Elliott Waves charts of the S&P500 index here for your learning.

Analyzing the hourly chart of S&P500 index
DIscussing human emotions after sell off in S&P500
Discussing human emotions after sell off in S&P500

Being aware of different possibilities in S&P500

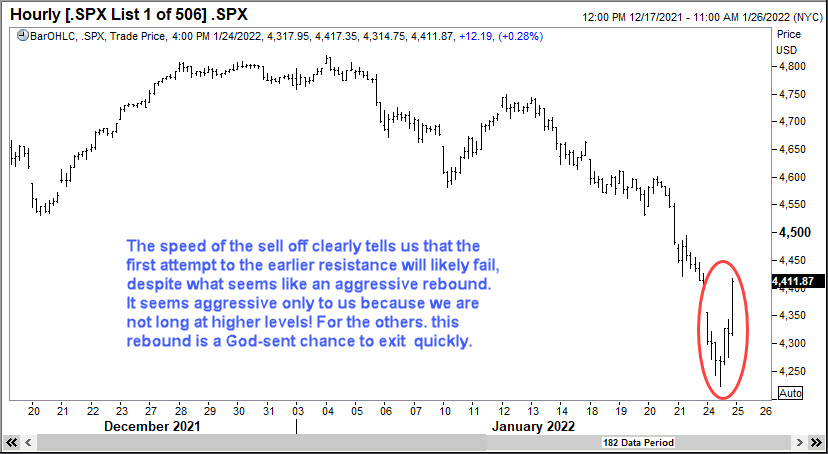
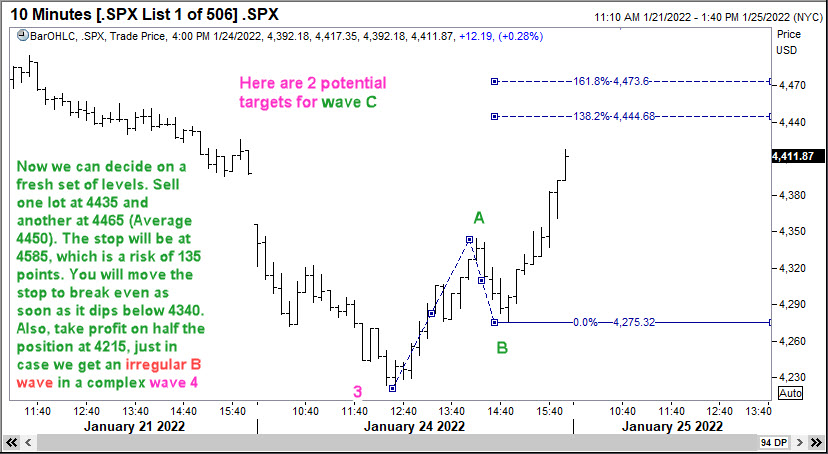
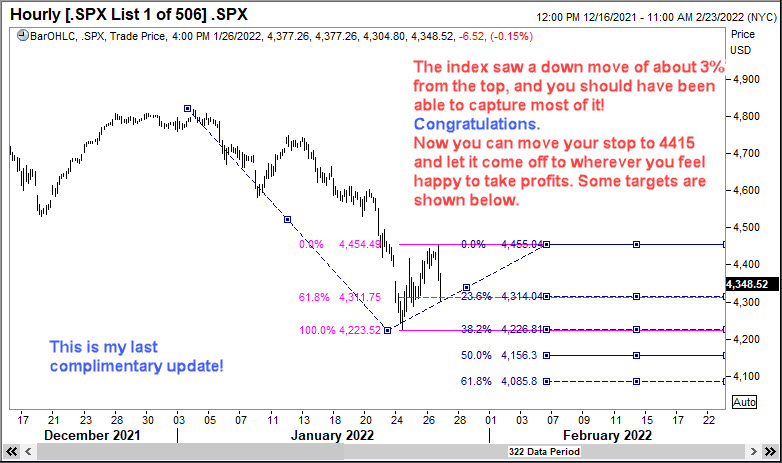
Being aware of different possibilities in S&P500And finally, today, after the move to the downside commenced…

Time to celebrate after the S&P500 moved down

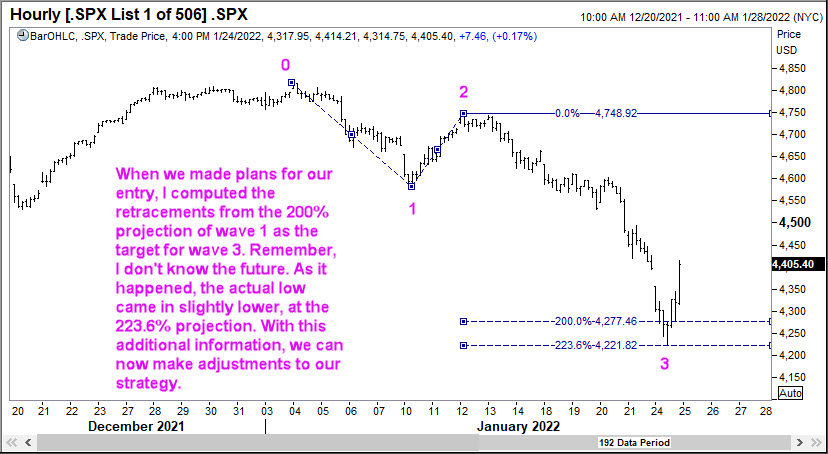
The key thing to note is we don’t know the future at any time. In the case of the S&P500 index, we used Elliott Waves to figure out what could be a reasonable low-risk level to trade. Of course, there are several other nuances that the other charts had, the things that I teach in my online Elliott Wave course available at https://elliottwaves.com. But suffice it to state here that if you learn the correct way to trade with Elliott Waves, you could take advantage of numerous opportunities that the markets present on a regular basis. There is really no need to be super-active to make money.

Announcement: The online Elliott Wave Course will go back to its full price on 1 February 2022! 

Elliott Waves S&P500
Share. Facebook Twitter Pinterest LinkedIn Tumblr Telegram Email
Previous ArticleHedge Funds and Elliott Waves – Netflix $NFLX
Next Article What Is The Nearest Technical Support For Meta (NASDAQ: FB)
Ramki
  • Website

Related Posts

SNP 500 Index in sideways move

November 7, 2020

A quick update on the S&P500 index

April 3, 2013

S&P update

September 15, 2012
Add A Comment

Leave A Reply Cancel Reply

Recent Posts
  • Has Meta (Facebook) stock seen the bottom
  • What Is The Nearest Technical Support For Meta (NASDAQ: FB)
  • Using Elliott Waves to Capture a Trade in S&P500
  • Hedge Funds and Elliott Waves – Netflix $NFLX
  • When Elliott Waves applauds the promoter’s signals!

WaveTimes is a Research Organization dedicated to providing original analysis, reports, reviews, and insights on developments in mutual funds, stocks, investing, foreign exchange, commodities, and bonds.

Contact WaveTimes

L-601 Mantri Espana,

Kariyammana Agrahara, Bellandur, Bangalore 560103

Follow Us

  • Facebook
  • YouTube
  • Twitter

© 2023 Wave Times. All Rights Reserved.
  • About
  • Books
  • Privacy Policy
  • Policies and Standards

Type above and press Enter to search. Press Esc to cancel.