• About
  • Elliott Waves
    • Elliott Waves Explained
    • Elliott Wave Magic Illustrated with Wave Charts
    • Elliott Wave Edge – How Elliott Wave Traders Win
    • Fibonacci Number Series and Elliott Waves
    • How to use Fibonacci Ratio Retracements
    • Elliott Wave Books
      • The Elliott Wave Book – Five Waves to Financial Freedom
      • Dividend Growth Investing Using Elliott Waves
    • Videos
  • Equities
    • Indices
      • Africa
        • Egypt
      • Australia
      • European Indices
        • AEX – Index, Amsterdam
        • DAX Index
        • Istanbul
        • Russia
        • Spain’s IBEX 35
      • Asian Indices
        • India
        • China
        • Dubai
        • Kuwait
        • Kuala Lumpur
        • Pakistan
        • Saudi
        • Taiwan
      • US Indices
        • S&P500
        • Nasdaq
        • Dow Jones
        • Dow Jones Utilities
    • Stocks
      • Asian Stocks
        • Indian Stocks Trading
        • Dubai Stocks Outlook
        • Japanese Stocks
        • Kuwait stocks
        • Saudi Stocks Outlook
      • African Stocks
        • Egyptian Stocks
      • Swiss Stocks
      • Australian Stocks
      • European Stocks
      • US Stocks outlook
      • UK Stocks
  • Commodities
    • Copper
    • Gasoline
    • Gold
    • Natural Gas
    • Oil
    • Palm Oil
    • Raw Sugar
    • Rubber
    • Soybean Oil
    • Silver
  • Forex
    • AUD
    • Bitcoin
    • CAD
    • CHF
    • Euro
    • GBP
    • INR
    • NZD
    • JPY
  • Raves
  • Consulting
    • Consulting
  • Ramki’s Watchlist
Top News

Has Meta (Facebook) stock seen the bottom

March 21, 2022

What Is The Nearest Technical Support For Meta (NASDAQ: FB)

February 7, 2022

Using Elliott Waves to Capture a Trade in S&P500

January 27, 2022
Facebook Twitter Instagram
WaveTimes Blog WaveTimes Blog
Wave times
  • About
  • Elliott Waves
    • Elliott Waves Explained
    • Elliott Wave Magic Illustrated with Wave Charts
    • Elliott Wave Edge – How Elliott Wave Traders Win
    • Fibonacci Number Series and Elliott Waves
    • How to use Fibonacci Ratio Retracements
    • Elliott Wave Books
      • The Elliott Wave Book – Five Waves to Financial Freedom
      • Dividend Growth Investing Using Elliott Waves
    • Videos
  • Equities
    • Indices
      • Africa
        • Egypt
      • Australia
      • European Indices
        • AEX – Index, Amsterdam
        • DAX Index
        • Istanbul
        • Russia
        • Spain’s IBEX 35
      • Asian Indices
        • India
        • China
        • Dubai
        • Kuwait
        • Kuala Lumpur
        • Pakistan
        • Saudi
        • Taiwan
      • US Indices
        • S&P500
        • Nasdaq
        • Dow Jones
        • Dow Jones Utilities
    • Stocks
      • Asian Stocks
        • Indian Stocks Trading
        • Dubai Stocks Outlook
        • Japanese Stocks
        • Kuwait stocks
        • Saudi Stocks Outlook
      • African Stocks
        • Egyptian Stocks
      • Swiss Stocks
      • Australian Stocks
      • European Stocks
      • US Stocks outlook
      • UK Stocks
  • Commodities
    • Copper
    • Gasoline
    • Gold
    • Natural Gas
    • Oil
    • Palm Oil
    • Raw Sugar
    • Rubber
    • Soybean Oil
    • Silver
  • Forex
    • AUD
    • Bitcoin
    • CAD
    • CHF
    • Euro
    • GBP
    • INR
    • NZD
    • JPY
  • Raves
  • Consulting
    • Consulting
  • Ramki’s Watchlist
WaveTimes Blog WaveTimes Blog
Home » Using Elliott Waves to anticipate a big sell off in Manappuram Finance Ltd
Indian Stocks Trading

Using Elliott Waves to anticipate a big sell off in Manappuram Finance Ltd

RamkiBy RamkiJune 2, 201816 Comments3 Mins Read
Facebook Twitter LinkedIn Telegram Pinterest Tumblr Reddit WhatsApp Email
Share
Facebook Twitter LinkedIn Pinterest Email

A few weeks ago, one of the members of the exclusive WaveTimes club approached for a consultation on Manappuram Finance Ltd. I am sharing several of the charts sent to him so that you can see how one could use Elliott Waves to anticipate the approaching important top and subsequent sell off.

As a background, this stock has been the darling of many traders and investors. Manappuram Finance Ltd stock has gone up from a low of around Rs 10 to above Rs 130 in under five years. When everyone is bullish for the stock, even a small negative news could turn the tide swiftly. But the stock turned even before the company reported a fall of 9.2% in its Q4 profits on 18 May 2018. Let us now see the picture using our Elliott Wave Analysis lens.
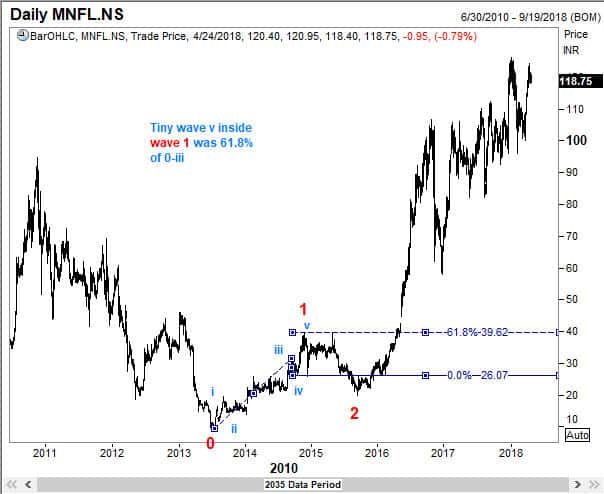
Wave 1 components

The chart below shows how we start counting from a significant low, and notice that sub wave v within wave 1 was 61.8% of the distance from point 0 to point 3.

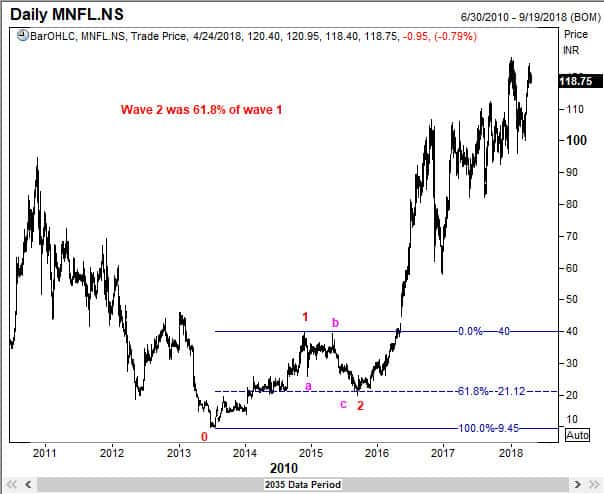
Wave 2 came down to the 61.8%

Once the first wave was finished, we saw a deep correction, where wave 2 of Manappuram Finance Ltd came down to the 61.8% retracement level. That would have been a low-risk purchase level in expectation of a strong wave 3 rally.


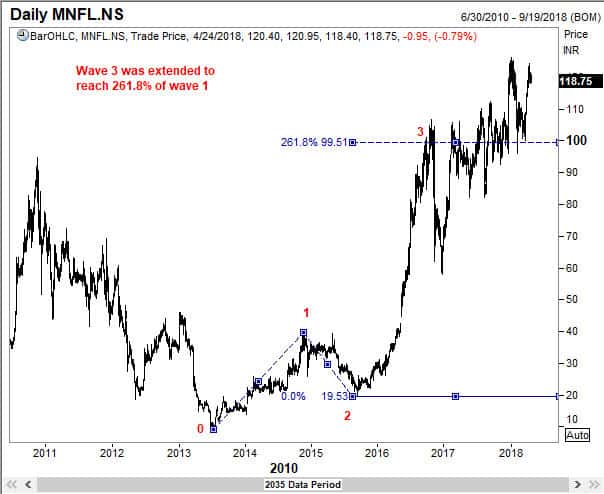
Extension seen in Wave 3

As we know from our studies of the Elliott Wave principle,  one of the three impulse waves often will extend. The best candidate for such a move is the third wave. We see from the Elliott Wave chart of Manappuram Finance Ltd that wave 3 has extended to reach 261.8% of wave 1.
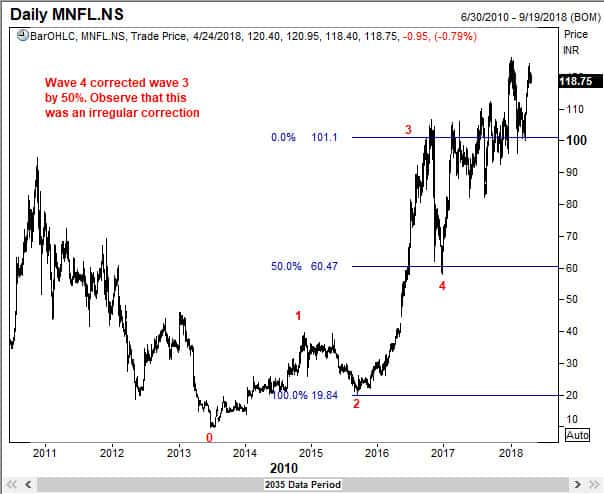
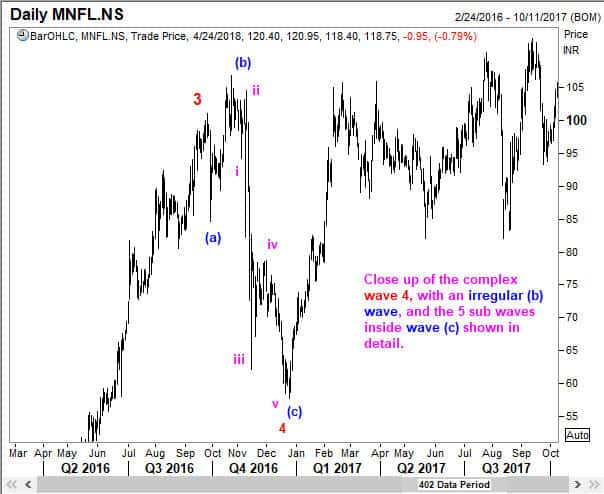
Complex wave 4

Following the extension in wave 3, we would have anticipated wave 4 to be short, but remember that this is only a tendency. Wave 4 in the case of Manappuram Finance turned out to be a complex correction (something that we would have expected as wave 2 was simple), but it came down to the 50% retracement as seen below.

You can also see how sub wave 5 inside wave c of wave 4 had its own 5 waves as seen below.

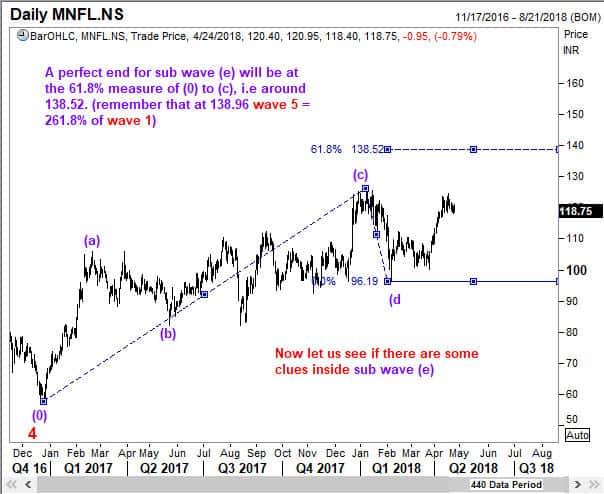
Anticipating the terminal points for wave 5

There are several valid ways of anticipating the end point of wave 5. These have been discussed in detail in my Elliott Wave book “Five Waves to Financial Freedom”.  While discussing these end points with my client on 24 April, 2018, I had mentioned that a perfect ending will happen around Rs 138.

And I also alerted him to the likely extent of a fall after wave 5 was finished. This is shown below.

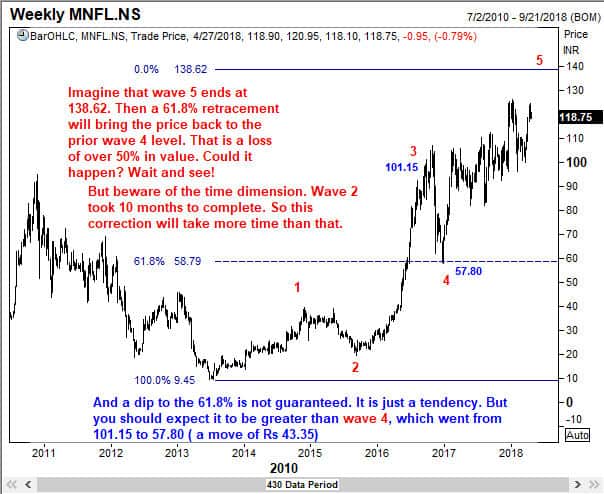
Anticipating extent of fall once the Elliott Wave Bull cycle is finished

There are some clues that we have to determine the dimensions of a decline once a 5-wave bull cycle is completed. These are discussed in FWTFF book. But briefly, we know that the correction will be bigger and last longer than either of the two corrections that happened in the bull cycle.

What happened next?

The actual high was posted on 9 May 2018, at 130.45. And as of 1 June 2018, ie in the space of just 3 weeks, Manappuram Finance Ltd went from being a much fancied stock to lose over 20% of its value, dipping to a low of Rs 99.60. And you can be sure that we still have plenty of room to go. The immediate resistance is at 113.40


Manappuram Finance MNFL.NS
Share. Facebook Twitter Pinterest LinkedIn Tumblr Telegram Email
Previous ArticleJust Dial Roars to life – An Elliott Wave perspective
Next Article How Elliott Wave helped us make over 16% in 6 weeks
Ramki
  • Website

Related Posts

When Elliott Waves applauds the promoter’s signals!

January 3, 2022

A soft quarter for TCS – Avoid or Add – Contd.

October 13, 2021

A soft quarter for TCS — Avoid or add?

October 12, 2021
View 16 Comments

16 Comments

  1. Shiva Narayanan on June 2, 2018 12:41 pm

    Very nice analysis Ramki. This one had perfect wave counts as explained in your book. But there are instances where the counts get confusing. Though the retrace ment count is achieved the wave couuntvus not. What do we do in such cases. For instance the wave 4on weekly above was clear 3 correction..what if it reached 61.8 in one wave? Which takes precedence. Thanks

    Reply
    • Ramki Ramakrishnan on June 17, 2018 2:14 pm

      Shiva, Please rephrase your question as I am not sure that I understood.

      Reply
  2. subhan on June 3, 2018 11:40 pm

    Thanks, very detailed and nicely illustrated. I couldn’t make out that wave 5 was diagnal triangle, unless I saw ABC formations, while the picture is so clear.

    Thanks again for your insights Sir.

    Reply
  3. Ian on June 5, 2018 8:11 pm

    Hi Ramki, love your analysis and big fan of your FWTFF book (nice review posted on Amazon!). In your analysis of Wave 5 you have labelled the sub waves a-e. I thought as wave 5 is an impulse wave the sub waves would also be 1-5? It almost looks like a diagonal to me (I am a beginner in EWT) – is that why the labels are letters rather than numbers? If it is a diagonal this would validate the possibility of a significant decline? Many thanks, Ian

    Reply
    • Ramki Ramakrishnan on June 17, 2018 2:07 pm

      Ian, Couple of quick points. I use the wave counts to ‘trade’ (not to prove to anyone that I can label correctly) and once the objective (which is to make money) has been met, I discard the count. The notations don’t matter to me, ie whether you label them 1,2,3,4,5 or a,b,c,d,e

      Reply
  4. Swapan Choudhury on June 25, 2018 10:52 am

    According to your analysis, 5th wave is a diagonal triangle, but what I learned from your book all “abcde” points must touch the boundary line of the diagonal (when drawn) and no part of bars should fall outside boundary line of the diagonal. In the instant case if point ‘b’ & point ‘d’ are connected then some price bars come out of that boundary line, when point ‘0’ and point ‘d’ are connected then point ‘b’ never touches the boundary, which is correct please reply.

    Reply
    • Ramki Ramakrishnan on June 26, 2018 4:55 am

      Swpan, In the real world, especially with diagonals, we have to allow for some behavior which does not confirm to a text book example. At the end of the day. we use our analysis to trade, to determine low-risk entry points. Good luck.

      Reply
  5. Omar on June 30, 2018 3:10 pm

    Hello Mr. Ramki,

    You have a wonderful website. I have a question in which I hope you can answer. Elliot mentioned a phenomena in the market called the half moon. Was this a pattern and is it valid in the Elliot Wave Principle? Thank you Sir for educating the public with your vast knowledge.

    Reply
    • Ramki Ramakrishnan on July 2, 2018 12:02 pm

      Hello Omar, Thank you for writing. I dont recollect having read about such a formation. Maybe this is the same as the cup and handle formation that is a good bottoming formation in classical analysis. All the best.

      Reply
  6. Omar Ahmed on July 2, 2018 11:26 pm

    Hello Ramki, Thank you for responding back. The pattern was mentioned in the first Elliot Wave book (1938). But EWI under Bob Pretcher disregarded it. I love reading your analysis on the market its precise and logical. Thank you once again for teaching us.

    Reply
  7. vishal sharma on October 27, 2018 5:05 pm

    Hello sir, i have been through your books and highly appreciate the kind of knowledge that you share with the website and the books, i have been trying to learn Elliot waves and there is one specific place where i get stuck again and again. I tend to make a mistake in counting sub waves within waves. like in the above case the sub waves of wave 3 i was finding it difficult to get and also since the wave 4 is a complex one the b wave goes above the sub wave 5 of wave 3. can you please help me how to count the waves properly in a lower time frame or to identify the sub waves at a lower time frame. It would be really helpful. Thanks.

    Reply
    • Ramki Ramakrishnan on October 28, 2018 4:09 am

      Vishal, Thank you for writing. You will appreciate that it is not easy to teach anyone in a response to a blog comment. I suggest that you read the book again, and if possible attend one of my workshops. All the best.

      Reply
  8. UDIT MODI on December 22, 2018 9:52 am

    Sir I have one query regarding to subwave of 5th wave. Here 5th wave is ending diagonal. I that I have seen abcde pattern . I am confused about this c wave. Is there any wxy pattern in c wave of ending diagonal or just ABC pattern ?

    Reply
    • Ramki Ramakrishnan on January 1, 2019 11:00 am

      Udit, My approach is not to sweat too much on the squiggles. The discussion becomes more academic then. You see 5 waves in the 5th wave and that means the cycle is approaching its end.

      Reply
  9. Ameet Mehta on July 8, 2019 2:54 pm

    Hello Sir! kudos from another admirer of waves! Seems we’re in climax of ‘c’ of A of the bigger correction? (counting a of A culmination at 134).

    Reply
    • Ramki Ramakrishnan on August 23, 2019 5:50 am

      Ameet, Thank you for your message!

      Reply

Leave A Reply Cancel Reply

Recent Posts
  • Has Meta (Facebook) stock seen the bottom
  • What Is The Nearest Technical Support For Meta (NASDAQ: FB)
  • Using Elliott Waves to Capture a Trade in S&P500
  • Hedge Funds and Elliott Waves – Netflix $NFLX
  • When Elliott Waves applauds the promoter’s signals!

WaveTimes is a Research Organization dedicated to providing original analysis, reports, reviews, and insights on developments in mutual funds, stocks, investing, foreign exchange, commodities, and bonds.

Contact WaveTimes

L-601 Mantri Espana,

Kariyammana Agrahara, Bellandur, Bangalore 560103

Follow Us

  • Facebook
  • YouTube
  • Twitter

© 2023 Wave Times. All Rights Reserved.
  • About
  • Books
  • Privacy Policy
  • Policies and Standards

Type above and press Enter to search. Press Esc to cancel.