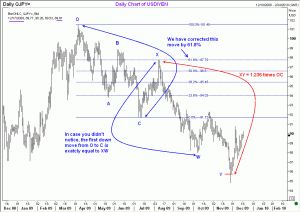
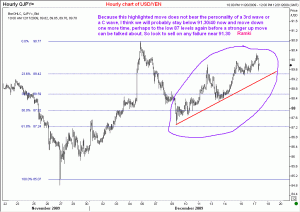
 Here is the outlook for USD/JPY in the near term. The first chart shows you some classic relationships between alternate waves. Interestingly, the point “Y” is not the absolute low. We have allowed that because it looks like a spike in the price. The second chart of USD/JPY is an hourly chart. When one is attempting to arrive at the outlook for any instrument, in this case USD/JPY, he/she should pay attention to the personality of the waves. The hourly chart of USD/JPY clearly shows that after correcting the first upmove to 90.77 by a down move to below 87.60, the USD/JPY is moving in a manner that does not bear the personality of a third wave or even a C wave. So we have to conclude that soner or later the USD/JPY will likely come down some more. If we see a failure near 91.30, then we should join in as the down move starts.

USD/JPY outlook 17 December 2009

Unleash your Potential
Transform your trading – Starting Today
