This post originally appeared on Wavetimes.com on 24 August 2013 and has been restored after a crash of the database. Hence the date is shown differently above. My apologies to those who posted comments, as these have been lost too:
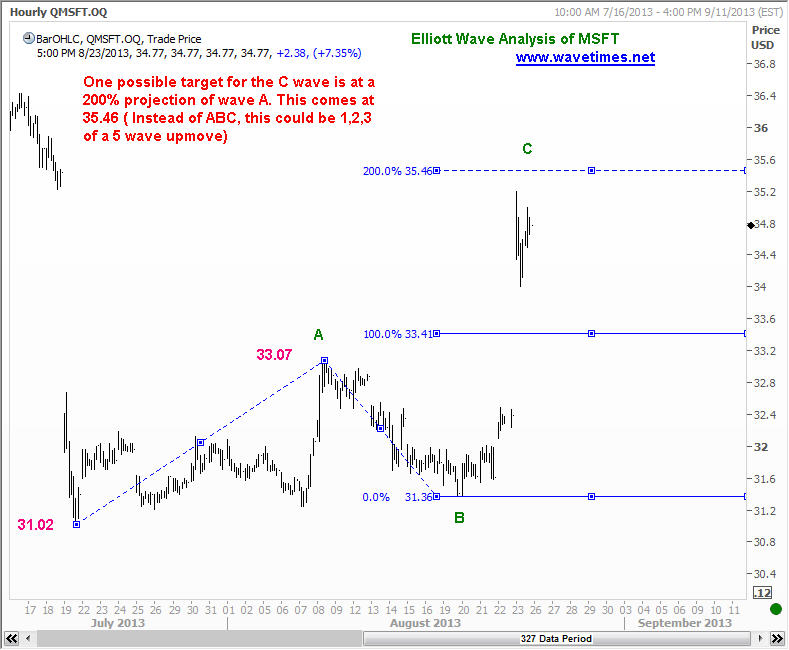
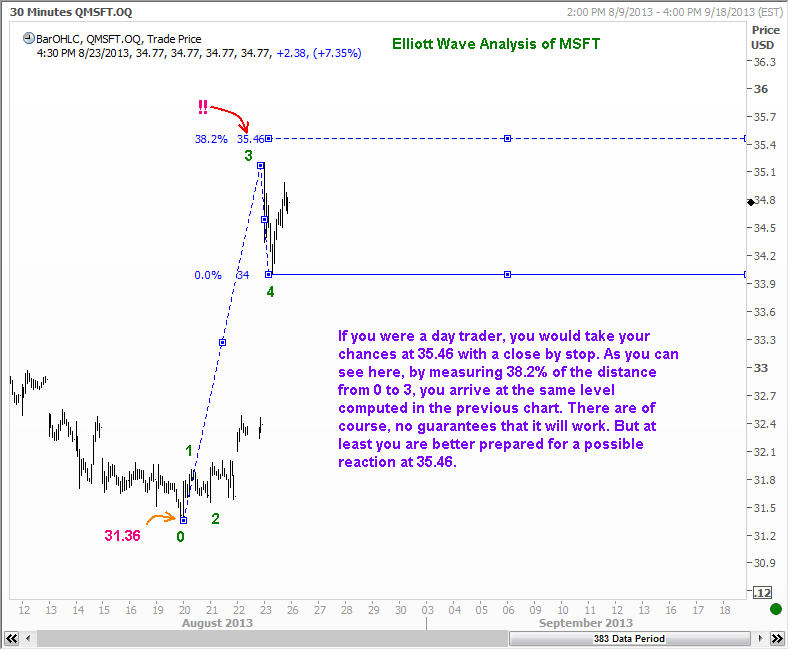
Well, are happy days here again for MSFT investors? Steve Ballmer has finally decided to hang up his boots and MSFT stock surged. Is this a relief rally, or is it a new uptrend? It is too soon to tell, but as Elliott Wave traders, we will keep an eye on the $35.46 level. At that level, we have a confluence of two Fobonacci projections. The first is a 200% projection for what could be either a 3rd wave rally, or a C wave. In order to see if that level can be assigned some more confidence, one can take a look at the sub-waves of the 3rd wave (or C wave, if you will). This wave should have 5 mini waves, and one would expect that the internal relationship will likely follow the typical Elliott Wave ratios.And sure enough, exactly at 35.46 we can arrive at ONE possible end point for the 5th mini wave of the latest rally. When we see two levels coinciding, we should be extra alert for at least a reaction. For the day trader, a reaction is all one needs. After all, his trading horizon is but only a few hours! Here are the Elliott Wave charts. Enjoy!