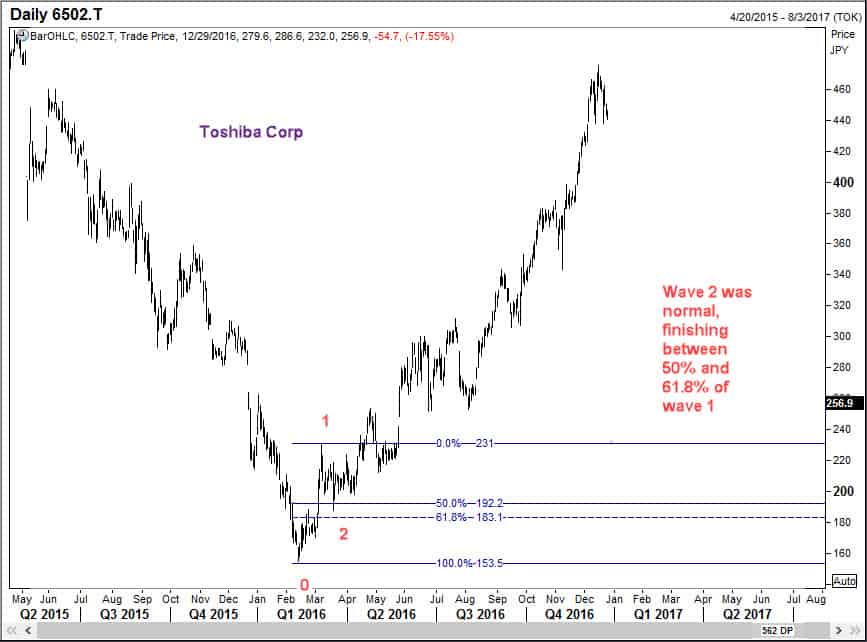
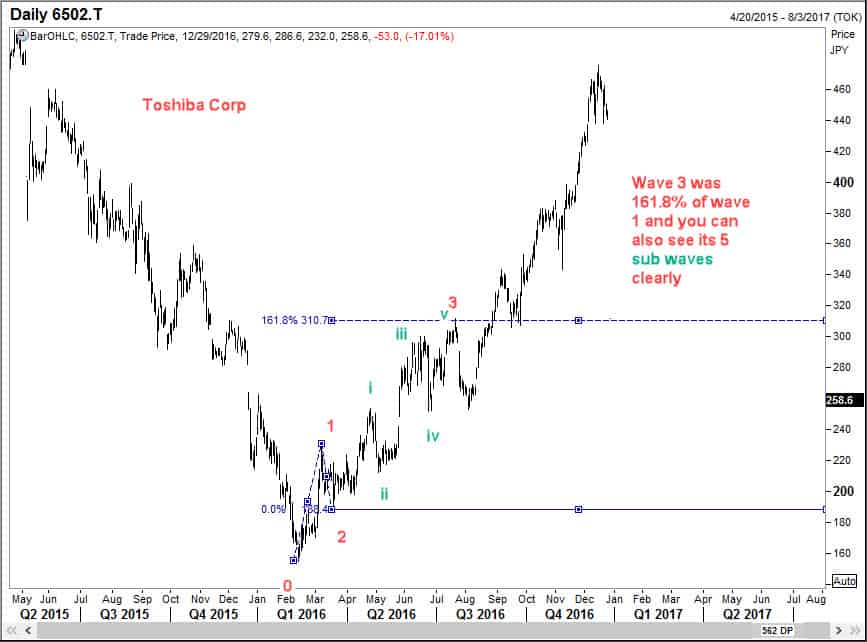
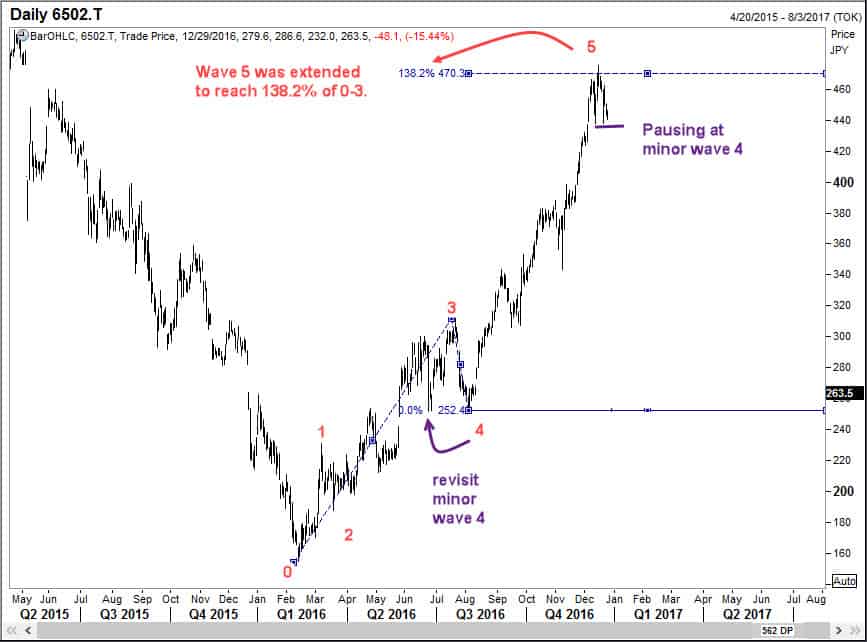
Regular readers of this blog would know that I call the occurrence of extended wave 5 as sheer magic, and Toshiba Corp is a case in question. We know that Toshiba has been having a great run since early 2016. From a low of 155 yen seen in February, the stock price of Toshiba Corp has been going up steadily, and reached a high of 475 on December 15, 2016. That means Toshiba Corp has tripled in value in just about 10 months. Now isn’t that wonderful? Imagine you are a fund manager who has been long and accumulating Toshiba at various supports. How would using Elliott Waves give you an edge? Let us take a look at several charts of Toshiba Corp and see how Elliott Wave analysis of Toshiba Corp would have helped us.
My comments on these charts of Toshiba Corp appear on the images directly. So I suggest that you open them on separate tabs first and then you can quickly read them one after the other.
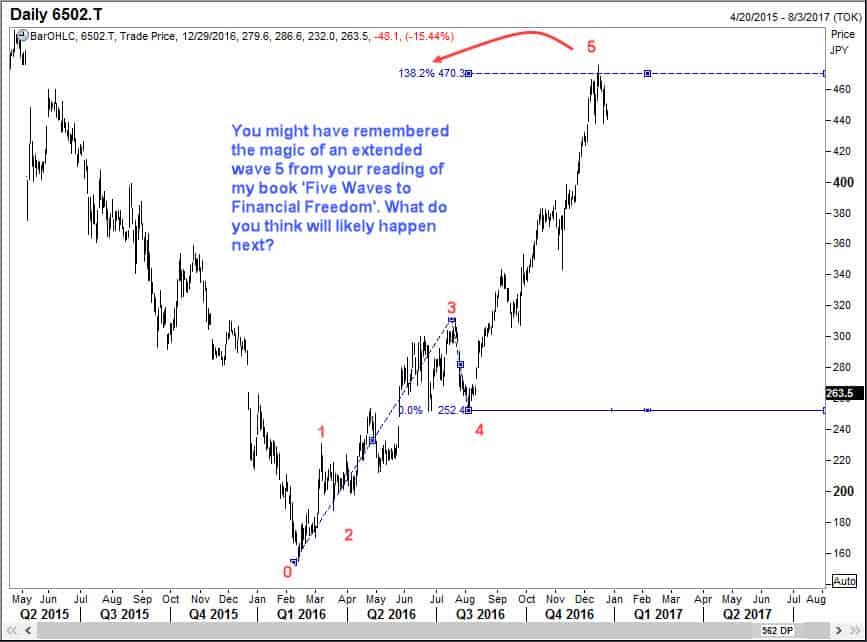
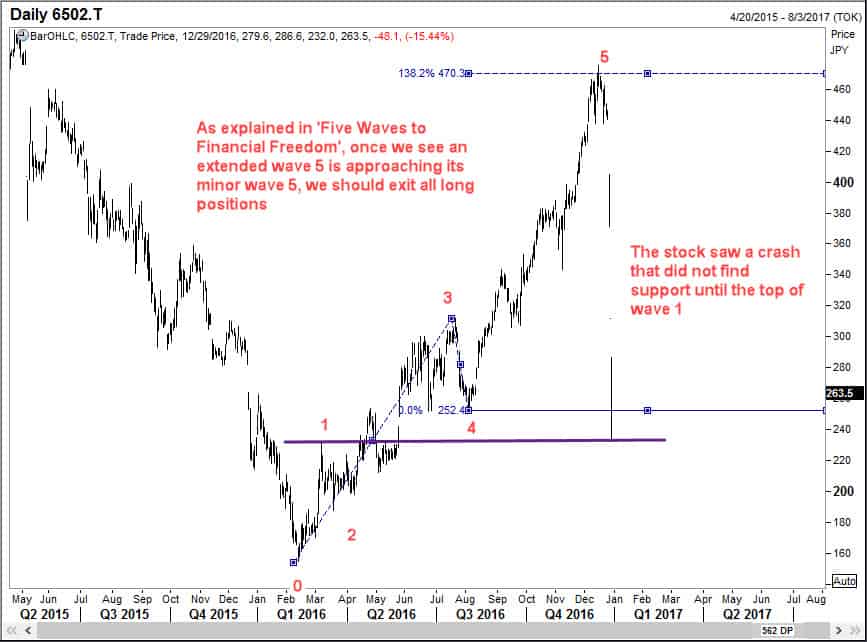
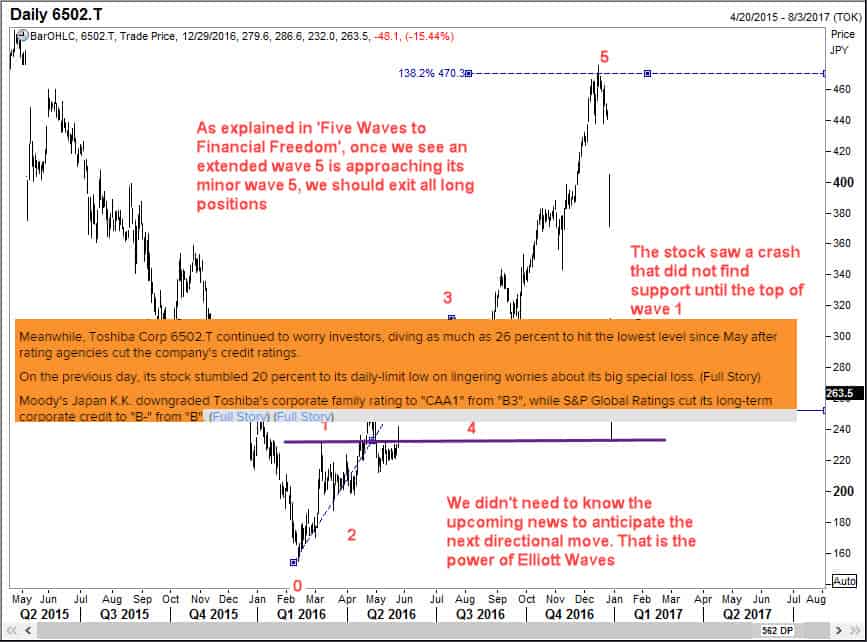
Do we need more evidence of the power, nay, the magic of Elliott Wave analysis and of extended wave 5 in particular! Go back to Five Waves to Financial Freedom, your Elliott Wave book of reference, and read about how you too could benefit in future from such situations.
