• About
  • Elliott Waves
    • Elliott Waves Explained
    • Elliott Wave Magic Illustrated with Wave Charts
    • Elliott Wave Edge – How Elliott Wave Traders Win
    • Fibonacci Number Series and Elliott Waves
    • How to use Fibonacci Ratio Retracements
    • Elliott Wave Books
      • The Elliott Wave Book – Five Waves to Financial Freedom
      • Dividend Growth Investing Using Elliott Waves
    • Videos
  • Equities
    • Indices
      • Africa
        • Egypt
      • Australia
      • European Indices
        • AEX – Index, Amsterdam
        • DAX Index
        • Istanbul
        • Russia
        • Spain’s IBEX 35
      • Asian Indices
        • India
        • China
        • Dubai
        • Kuwait
        • Kuala Lumpur
        • Pakistan
        • Saudi
        • Taiwan
      • US Indices
        • S&P500
        • Nasdaq
        • Dow Jones
        • Dow Jones Utilities
    • Stocks
      • Asian Stocks
        • Indian Stocks Trading
        • Dubai Stocks Outlook
        • Japanese Stocks
        • Kuwait stocks
        • Saudi Stocks Outlook
      • African Stocks
        • Egyptian Stocks
      • Swiss Stocks
      • Australian Stocks
      • European Stocks
      • US Stocks outlook
      • UK Stocks
  • Commodities
    • Copper
    • Gasoline
    • Gold
    • Natural Gas
    • Oil
    • Palm Oil
    • Raw Sugar
    • Rubber
    • Soybean Oil
    • Silver
  • Forex
    • AUD
    • Bitcoin
    • CAD
    • CHF
    • Euro
    • GBP
    • INR
    • NZD
    • JPY
  • Raves
  • Consulting
    • Consulting
  • Ramki’s Watchlist
Top News

Has Meta (Facebook) stock seen the bottom

March 21, 2022

What Is The Nearest Technical Support For Meta (NASDAQ: FB)

February 7, 2022

Using Elliott Waves to Capture a Trade in S&P500

January 27, 2022
Facebook Twitter Instagram
WaveTimes Blog WaveTimes Blog
Wave times
  • About
  • Elliott Waves
    • Elliott Waves Explained
    • Elliott Wave Magic Illustrated with Wave Charts
    • Elliott Wave Edge – How Elliott Wave Traders Win
    • Fibonacci Number Series and Elliott Waves
    • How to use Fibonacci Ratio Retracements
    • Elliott Wave Books
      • The Elliott Wave Book – Five Waves to Financial Freedom
      • Dividend Growth Investing Using Elliott Waves
    • Videos
  • Equities
    • Indices
      • Africa
        • Egypt
      • Australia
      • European Indices
        • AEX – Index, Amsterdam
        • DAX Index
        • Istanbul
        • Russia
        • Spain’s IBEX 35
      • Asian Indices
        • India
        • China
        • Dubai
        • Kuwait
        • Kuala Lumpur
        • Pakistan
        • Saudi
        • Taiwan
      • US Indices
        • S&P500
        • Nasdaq
        • Dow Jones
        • Dow Jones Utilities
    • Stocks
      • Asian Stocks
        • Indian Stocks Trading
        • Dubai Stocks Outlook
        • Japanese Stocks
        • Kuwait stocks
        • Saudi Stocks Outlook
      • African Stocks
        • Egyptian Stocks
      • Swiss Stocks
      • Australian Stocks
      • European Stocks
      • US Stocks outlook
      • UK Stocks
  • Commodities
    • Copper
    • Gasoline
    • Gold
    • Natural Gas
    • Oil
    • Palm Oil
    • Raw Sugar
    • Rubber
    • Soybean Oil
    • Silver
  • Forex
    • AUD
    • Bitcoin
    • CAD
    • CHF
    • Euro
    • GBP
    • INR
    • NZD
    • JPY
  • Raves
  • Consulting
    • Consulting
  • Ramki’s Watchlist
WaveTimes Blog WaveTimes Blog
Home » The wonderful opportunities following an extended fifth wave illustrated
Indian Stocks Trading

The wonderful opportunities following an extended fifth wave illustrated

RamkiBy RamkiJanuary 7, 20193 Comments4 Mins Read
Facebook Twitter LinkedIn Telegram Pinterest Tumblr Reddit WhatsApp Email
Extended Fifth Wave in Jai Corp Ltd
Share
Facebook Twitter LinkedIn Pinterest Email

With Elliott Waves, there are numerous places in the development of a cycle that can be profitably exploited. This post shows you a most recent example, from just one trading day earlier. The wonderful opportunities following an extended fifth wave is illustrated, so that you can learn which battles you should be involved in. A majority of traders lose in the markets because they randomly buy or sell. That is not the approach which I recommend. In my book, as well as in my seminars, I teach how to be patient until a low-risk opportunity presents itself.

Generally speaking, I don’t recommend you go any lower than an hourly chart for the purpose of trading, unless you feel you have sufficient experience using Elliott Waves. The daily charts are best because a lot of noise is eliminated. However, for the purpose of illustrating how to exploit an extended fifth wave, (as well as to make some money in the process!) I have chosen a 10-minute chart.

Identifying an Extended Fifth Wave in Jai Corp Ltd

Extended Fifth Wave in Jai Corp Ltd

When you look at any chart, pay attention to the waves. We know that very often, one of the three impulse waves will extend. And if you are lucky enough to spot a chart where the fifth wave is experiencing an extension, then you can rub your hands in glee, because not only will we get a snap back to the minor wave 2 inside the extended fifth wave, but also the move will be relatively quick.

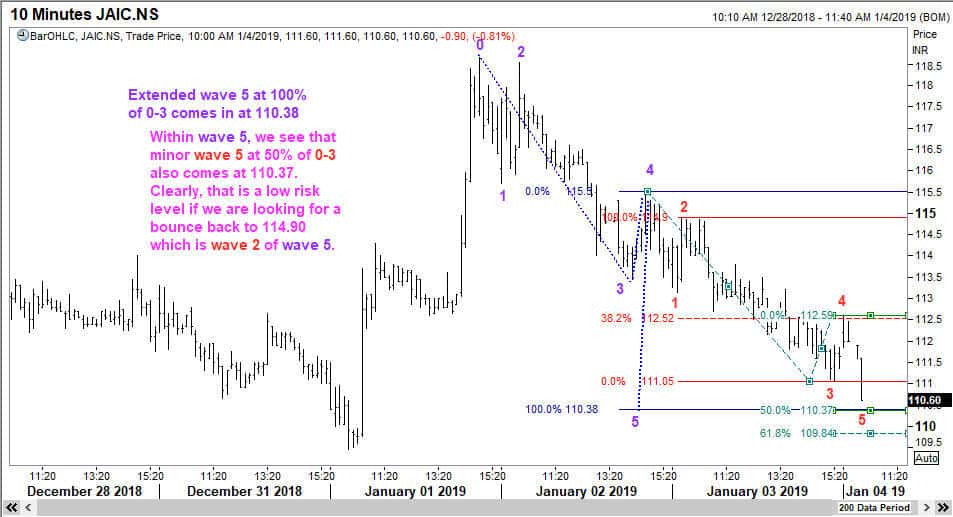
In the above chart, you can see the 5 waves quite clearly, and you are also able to see 5 tiny waves inside the third wave, even though I have not marked it out so that we don’t make the chart too busy.

More importantly, I have shown that at 100% of 0-3 (the violet labels), the target for extended wave 5 will be 110.38. Simultaneously, I have also shown the target for wave 5 (red color) inside the larger fifth wave has two targets, one at 50% that falls almost at the same level of the prior target (110.35) and another, at 61.8% of 0-iii at 109.84.  This analysis was done around 10 a.m. on January 4, 2019. Having done the analysis, what is the next step?  (a) You can sit back and see what happens (b) You can take action and get some exposure to the market. After all, the whole point of the analysis is to determine where to enter the trade. So this is what I did.

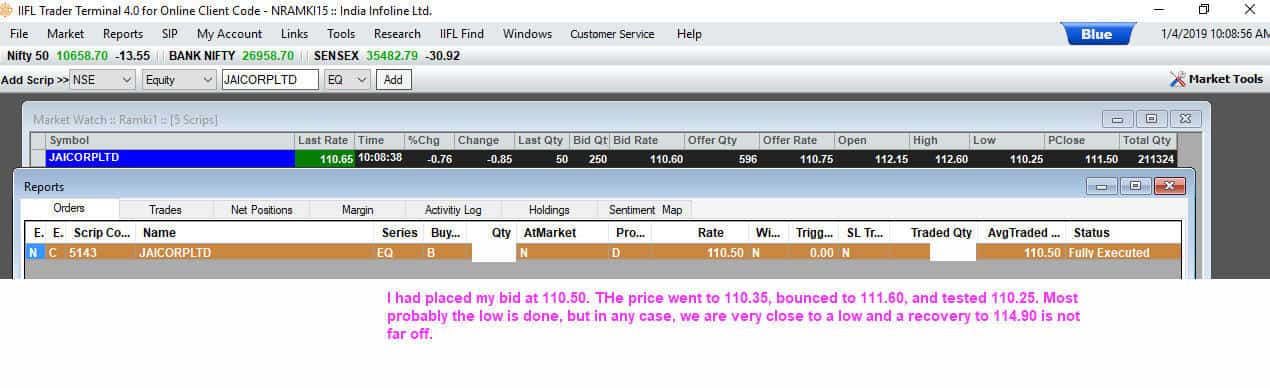
I can place my buy order at 110.40 (2 paise above the target) and miss the entire trade, or I could be a tiny little more aggressive, and place a bid at 110.50. So I did the sensible thing and placed a buy order at 110.50. As always, when we choose to be aggressive, the price will reach the target and beyond 🙂 but we should be prepared for that. The only way to defend yourself is to trade a position size that lets you ride out such a turn of events.

Entered my buy order in Jai Corp
You can see that my trade was done before 10.08 a.m. during which time the stock went down to 110.35, rallied back to 111.60 and got sold off again to 110.25.

Once my buy order was done, I could do several things, but mainly, I could sit glued to my screen and sweat at every price update, or I could place my profit order and do something else. This is what I did.

Placed my take-profit order

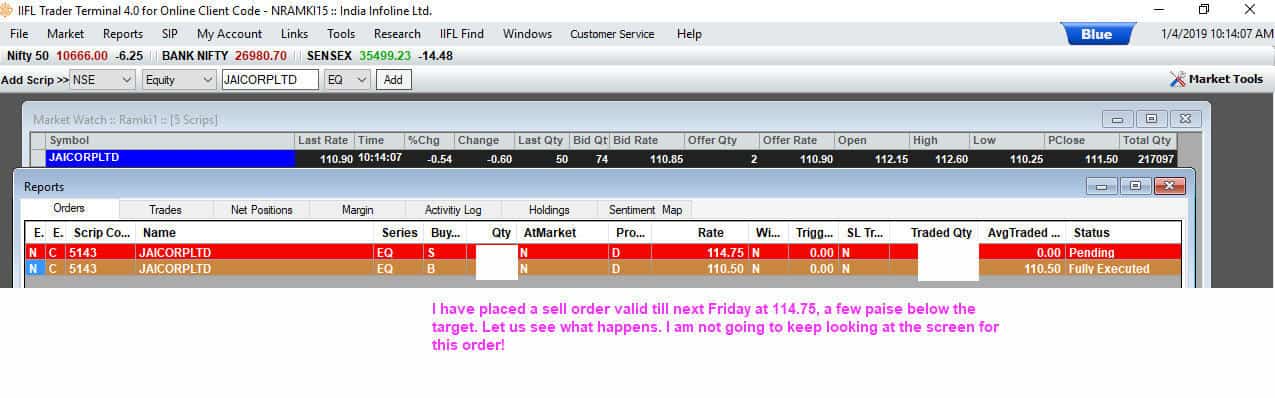
I placed my take-profit order at 114.75, a few paise ahead of the 114.90 target. I made the order valid till next Friday, shut down my laptop, and continued with other things. But just before I switched off, I saw that the price had reached 109.80, which would have been a perfect level to buy as that was the 2nd target I had anticipated. But that is life!

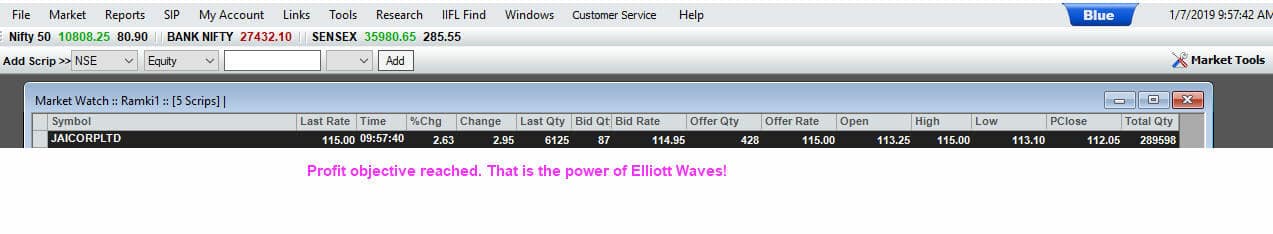
And today, when I opened my Laptop and checked the price, lo-and-behold, the profit order was executed. Could the price go higher? Of course, it could. Why did I choose to sell at 114.75 and not wait? I had a plan, and I just executed that plan. Every day hundred of stocks go up and down by much more than what I made on this stock. Can I be worried about missing the action in all of them? The secret is to take the low-hanging fruits and enjoy life.

Jai Corp profit target reached
Jai Corp profit target reached!
5th wave extension Elliott Waves Extension Extended fifth wave Jai Corp Ltd
Share. Facebook Twitter Pinterest LinkedIn Tumblr Telegram Email
Previous ArticleIrregular Correction – Example from FWTFF book
Next Article Ramki’s next Elliott Wave Workshop at Pune on 9 March 2019
Ramki
  • Website

Related Posts

What Is The Nearest Technical Support For Meta (NASDAQ: FB)

February 7, 2022

When Elliott Waves applauds the promoter’s signals!

January 3, 2022

A soft quarter for TCS – Avoid or Add – Contd.

October 13, 2021
View 3 Comments

3 Comments

  1. Omar Ahmed on January 30, 2019 3:24 pm

    Hello Mr. Ramki,

    Excellent Analysis! I have a question when we have an ABC wave there should be divergence between wave A and C. However. the market then turns complex WXYXZ. Does the principle give us a clue when this can happen in reference to using indicators?

    Thank you

    Reply
    • Ramki Ramakrishnan on February 7, 2019 4:58 pm

      Hi Omar, You are speaking of a complex correction, which, by definition, throws up sequences which cannot be anticipated consistently.

      Reply
  2. Shakeel Ahmed on February 23, 2019 4:43 am

    A lot of trading experiences Ramki Sir has gained.Thanks a lot for sharing ….

    Reply

Leave A Reply Cancel Reply

Recent Posts
  • Has Meta (Facebook) stock seen the bottom
  • What Is The Nearest Technical Support For Meta (NASDAQ: FB)
  • Using Elliott Waves to Capture a Trade in S&P500
  • Hedge Funds and Elliott Waves – Netflix $NFLX
  • When Elliott Waves applauds the promoter’s signals!

WaveTimes is a Research Organization dedicated to providing original analysis, reports, reviews, and insights on developments in mutual funds, stocks, investing, foreign exchange, commodities, and bonds.

Contact WaveTimes

L-601 Mantri Espana,

Kariyammana Agrahara, Bellandur, Bangalore 560103

Follow Us

  • Facebook
  • YouTube
  • Twitter

© 2023 Wave Times. All Rights Reserved.
  • About
  • Books
  • Privacy Policy
  • Policies and Standards

Type above and press Enter to search. Press Esc to cancel.