• About
  • Elliott Waves
    • Elliott Waves Explained
    • Elliott Wave Magic Illustrated with Wave Charts
    • Elliott Wave Edge – How Elliott Wave Traders Win
    • Fibonacci Number Series and Elliott Waves
    • How to use Fibonacci Ratio Retracements
    • Elliott Wave Books
      • The Elliott Wave Book – Five Waves to Financial Freedom
      • Dividend Growth Investing Using Elliott Waves
    • Videos
  • Equities
    • Indices
      • Africa
        • Egypt
      • Australia
      • European Indices
        • AEX – Index, Amsterdam
        • DAX Index
        • Istanbul
        • Russia
        • Spain’s IBEX 35
      • Asian Indices
        • India
        • China
        • Dubai
        • Kuwait
        • Kuala Lumpur
        • Pakistan
        • Saudi
        • Taiwan
      • US Indices
        • S&P500
        • Nasdaq
        • Dow Jones
        • Dow Jones Utilities
    • Stocks
      • Asian Stocks
        • Indian Stocks Trading
        • Dubai Stocks Outlook
        • Japanese Stocks
        • Kuwait stocks
        • Saudi Stocks Outlook
      • African Stocks
        • Egyptian Stocks
      • Swiss Stocks
      • Australian Stocks
      • European Stocks
      • US Stocks outlook
      • UK Stocks
  • Commodities
    • Copper
    • Gasoline
    • Gold
    • Natural Gas
    • Oil
    • Palm Oil
    • Raw Sugar
    • Rubber
    • Soybean Oil
    • Silver
  • Forex
    • AUD
    • Bitcoin
    • CAD
    • CHF
    • Euro
    • GBP
    • INR
    • NZD
    • JPY
  • Raves
  • Consulting
    • Consulting
  • Ramki’s Watchlist
Top News

Has Meta (Facebook) stock seen the bottom

March 21, 2022

What Is The Nearest Technical Support For Meta (NASDAQ: FB)

February 7, 2022

Using Elliott Waves to Capture a Trade in S&P500

January 27, 2022
Facebook Twitter Instagram
WaveTimes Blog WaveTimes Blog
Wave times
  • About
  • Elliott Waves
    • Elliott Waves Explained
    • Elliott Wave Magic Illustrated with Wave Charts
    • Elliott Wave Edge – How Elliott Wave Traders Win
    • Fibonacci Number Series and Elliott Waves
    • How to use Fibonacci Ratio Retracements
    • Elliott Wave Books
      • The Elliott Wave Book – Five Waves to Financial Freedom
      • Dividend Growth Investing Using Elliott Waves
    • Videos
  • Equities
    • Indices
      • Africa
        • Egypt
      • Australia
      • European Indices
        • AEX – Index, Amsterdam
        • DAX Index
        • Istanbul
        • Russia
        • Spain’s IBEX 35
      • Asian Indices
        • India
        • China
        • Dubai
        • Kuwait
        • Kuala Lumpur
        • Pakistan
        • Saudi
        • Taiwan
      • US Indices
        • S&P500
        • Nasdaq
        • Dow Jones
        • Dow Jones Utilities
    • Stocks
      • Asian Stocks
        • Indian Stocks Trading
        • Dubai Stocks Outlook
        • Japanese Stocks
        • Kuwait stocks
        • Saudi Stocks Outlook
      • African Stocks
        • Egyptian Stocks
      • Swiss Stocks
      • Australian Stocks
      • European Stocks
      • US Stocks outlook
      • UK Stocks
  • Commodities
    • Copper
    • Gasoline
    • Gold
    • Natural Gas
    • Oil
    • Palm Oil
    • Raw Sugar
    • Rubber
    • Soybean Oil
    • Silver
  • Forex
    • AUD
    • Bitcoin
    • CAD
    • CHF
    • Euro
    • GBP
    • INR
    • NZD
    • JPY
  • Raves
  • Consulting
    • Consulting
  • Ramki’s Watchlist
WaveTimes Blog WaveTimes Blog
Home » The Practice of Elliott Wave Analysis
India

The Practice of Elliott Wave Analysis

RamkiBy RamkiJanuary 17, 201293 Comments1 Min Read
Facebook Twitter LinkedIn Telegram Pinterest Tumblr Reddit WhatsApp Email
Share
Facebook Twitter LinkedIn Pinterest Email

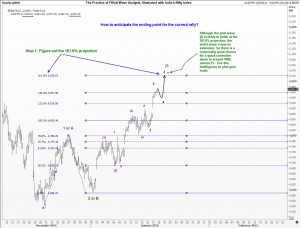
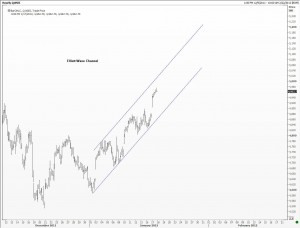
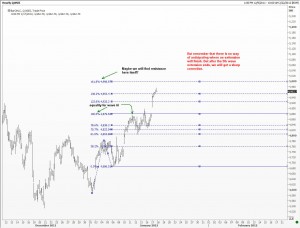
I have been receiving several messages from traders who seem to have fallen prey to the age old impulse of selling into a rally, when everything we know tells us to be patient to buy the dip. The fact that the dip did not materialize should not be the excuse to sell! You should always ask yourself what is the major direction that we want to be trading? If we are looking for a dip of 100 points to go long for a move of 600 points, does it make sense to sell after a recovery of 150 points?? THis is what many traders have done in the last few days with India’s Nifty. It doesn’t matter if you have no position in that market. Just see how I would deal with an error like that, and learn from it.As always, there are comments posted directly on the chart. Enjoy.(PS These are the same techniques I have taught you in the book “Five Waves to Financial Freedom”)

Nifty NSE
Share. Facebook Twitter Pinterest LinkedIn Tumblr Telegram Email
Previous ArticleTesco (LSE) outlook using Elliott Wave Analysis
Next Article Bajaj Auto: Elliott Wave update
Ramki
  • Website

Related Posts

How Elliott Waves helped WaveTimes members to exit before the stock market crash

March 27, 2020

How we traded Castrol India using Elliott Waves

December 9, 2019

Nifty rallied up in 5 waves

July 10, 2015
View 93 Comments

93 Comments

  1. Piyush Shah on January 17, 2012 4:23 am

    Dear Ramkiji,

    In your Nifty chart you have marked pink (3) at Fibo level 161% and value around 5020 and you have also mentioned that after that you see 2% correction values at around 4900 will it be pink (4)..?? or it will be i of (4) & then ii & iii & Then we will be having pink (5)..??!! If yes, can you give that approx level value..?? please clarify to my confusion..,

    Reply
    • Ramki on January 17, 2012 6:32 am

      Hi Piyush, as we don’t know if this is an ABC or 1/2/3/4/5 , we cannot be sure of a fifth wave just yet.

      Reply
  2. Pankaj on January 17, 2012 9:42 am

    Ramki sir,
    Please correct my understanding :Irrespective of if we are in wave 3 or wave C we should have a pink (v) as both waves should be made up of 5 waves. Can wave C be made up 3 waves in this case?

    Reply
    • Ramki on January 17, 2012 11:23 am

      Pankaj, all C waves should have five internal waves

      Reply
  3. ankur aditya on January 17, 2012 9:51 am

    Hello Ramki Sir! I just wanted to ask you that if this is a third wave in which we r riding and if it ends at 5020 ie 161.8% retracement which is said to be a normal wave again then can we anticipate the 5th wave as an extended wave? pls reply………

    Reply
    • Ramki on January 17, 2012 11:22 am

      Hi Ankur, t is because I am unsure whether we are still in a correction that I have labeled the waves tentatively. If we one down and rally again, then that will complete a Five wave upmove, making the bigger picture more positive

      Reply
  4. Trevor on January 17, 2012 1:45 pm

    Ramki,

    We well understand that your schedule is busy. However, if you could comment on the SPX, your insight would be greatly appreciated. Thanks again.

    Trevor

    Reply
  5. Joe Terra on January 17, 2012 3:13 pm

    Hi, Ramki, thanks for the great work. Can you please update your view on S&P when you have a moment?

    Reply
  6. rajesh on January 17, 2012 8:41 pm

    hello ramkiji.this is on usdinr.wehave just completed a 5th extended on 15th dec @54.32.and are correcting this upmove.i was looking at this chart from 1997 where the 1st 5th wave completes in 2002 and we correct till 2008 in an A/B/C.the next upmove takes us to 52.13 and corrects in an ABC into price territory of wave 1 in 2002.im confused.if this is the scenerio then we must correct now to around 38?please advice and label the chart while posting.thanks and regards

    Reply
    • Ramki on January 17, 2012 10:37 pm

      Hi Rajesh, please review all my prior posts on USDINR and you can see what wave count i had in mind

      Reply
  7. Sidharth Sehgal on January 17, 2012 9:17 pm

    Sir,

    is it wise to correlate Dow Jones and Nifty Charts in present scenario when it seems Dow may correct to new lows in coming weeks/months.?

    Reply
    • Ramki on January 17, 2012 10:39 pm

      Siddarth, while stock markets do take their cues from each other, I havent done any corelation studies.

      Reply
  8. vikram on January 18, 2012 1:36 am

    Ramki sir,

    I have read your book, and it has helped me a lot in my trading. To improve myself i have even started writing a blog.

    Just to add a few things, what has given me success is, I try to label the charts in all possible ways, so that i am aware of the alternative count as well. But I initiate a trade only when i see a low risk probability.

    Once again i am very thankful for you sir.

    regards

    vikram

    Reply
    • Ramki on January 18, 2012 1:59 am

      Hi Vikram, Good luck with your trading and your blog.

      Reply
  9. hemin on January 18, 2012 5:18 am

    Sir,
    please give us to road map for L&T OR any wave count change? (your projection is 1190 now hi is 1286.95

    Reply
  10. Pankaj on January 18, 2012 9:17 am

    Ramki sir,
    Are you saying if we see a correction of the extended wave it would be a low risk opportunity to join in the trend here ? If yes why not wait for a correction of pink 5 as it will be a correction of larger degree.

    Reply
    • Ramki on January 18, 2012 9:27 am

      Hi Pankaj, I think my comments are clear about what it conveys. You shouldnt read between the lines and interpret it in a way that is more appealing!

      Reply
  11. Pankaj on January 18, 2012 7:39 pm

    Thanks ramki sir..I read your comments again and get it now.

    Reply
  12. SIDHARTH on January 18, 2012 10:45 pm

    sir,
    one more possible count seems: A finished at 4535 from 5400 ( in 5 waves and with in rules of EW theory) and currently we are in Wave B
    Pls advice 🙂

    regards
    Sidharth

    Reply
    • Ramki on January 18, 2012 11:48 pm

      Hi Sidharth, As i often remind readers here, just about any count is possible, and we wont know what is the right one until after the move. You need to learn how to deal with your count. That is the secret to success.

      Reply
  13. digvijay bhandari on January 19, 2012 2:04 am

    sir,,, we already reached 5020 big big congrats to u ,,, i have just started following u and read u articles ,,,,lets hope that is comes down to @4900 levels to again move in5350-5400 levels —-kindly correct me if i am wrong ,,,,,this is wt i have come to the conclusion from u r blog —-regds

    Reply
  14. KARTHIK on January 19, 2012 7:42 am

    Dear Sir,
    Great Analysis by you. Hats off.
    So now 5022 is reached. Hope to see 4900 again.
    Thanks

    Reply
  15. R BHANJA on January 19, 2012 11:34 am

    Ending diagonals (3-3-3-3-3) are observed normally either in wave-5 or or wave-C . However, wave-5 may come in any 5-wave impulse structure of wave-I or III or V. Thus can we observe ending diagonals in any wave-5 of wave-I or wave-5 of wave-III or wave-5 of wave-V. I am asking this as hourly / half-hourly charts of NIFTY indicate development of a diagonal type structure. Of course, not yet confirmed as wave-e yet to develop.

    Reply
    • Ramki on January 19, 2012 1:02 pm

      Hi Bhanja, your observations about ending diagonals are correct

      Reply
  16. RamV on January 19, 2012 10:30 pm

    Dear Ramki,

    Followed your blogs, went long at 4600 with stop loss of 4500. Thanks for your analysis, sitting on a healthy profit after a long time 🙂

    NIFTY moved decisively over 5020. Implications of this move, the way I see:

    1) Green 3 or Green C wave is turning out to be Extended wave.
    2) The probability is now higher for the upward move from 4531 will turn into 1-2-3-4-5 wave than A-B-C corrective wave

    Question that I have is: Are there any other clue that will tell us if we are 1-2-3-4-5 or A-B-C?

    Regards,
    –RamV

    Reply
    • Ramki on January 19, 2012 10:58 pm

      Hi RamV, well done. I am happy that you understood what WaveTimes was trying to convey down there! Yes, as mentioned recently, we can’t be certain where an extension will finish. Regarding your other question, I suggest you read the section in my book dealing with reflex points.

      Reply
  17. vikram on January 19, 2012 11:28 pm

    Dear Ramki and RamV,

    The reflex point is 4806 now, Hope u agree

    Reply
  18. salimkabani on January 20, 2012 2:39 am

    sir,
    Nifty has been corrected from 5055 i.e. nearer of 61.8% retracement of =5382-4532. I hope that it starts to correct. Nifty went up more than our target i.e. 5020. Will it effect on down target 4424. Pl. Guide.

    Reply
  19. nath on January 20, 2012 9:16 am

    sir,
    can you please do an elliotwave analysis of bank nifty if time permits

    Reply
  20. amit on January 21, 2012 4:52 am

    hello sir
    can it be possible that A=5400-4640
    a of B=4640-5100
    b of B=5100-4531
    c of B=4531-5100 or5170
    and after that wave C start

    Reply
  21. Ashutosh on January 21, 2012 7:04 pm

    Most probably this is an ABC and not 1,2,3.4,5. Also 200 EMA is at 5130 which is almost achieved by the futures.I was reading anoher blog which tells us that a sharp correction is just around the corner.As you said earlier,4430 is now next destination.I had also mentioned in an earlier comment that towards the close of Feb,the correction will be over,for a significant Lucas time bar is waiting.If we closely watch the chart,perhaps a dead cross is also on the verge.Thank you Ramki for your enlightened analysis.You have been the most accurate analyst so far.Great going , Sir! I am a great fan of your’s and and the book “five waves to financial freedom” is a great help.God bless you !

    Reply
    • Ramki on January 21, 2012 7:42 pm

      Hi Pankaj, Amit and Ashutosh, while the possibility exists that we are in an irregular correction within the third zigzag, I would not chase that idea. Very often in my experience, my first target proves correct ( in this case 4535) Subsequent efforts to further fine tune the levels results in poorer results. This is why I invested some money in index tracking mutual funds when we were close to 4600.The goal is to make use of the analysis to take low risk trading and investment decisions, not to be proved accurate.

      Reply
  22. salimkabani on January 21, 2012 10:25 pm

    It is extended to 5065. I still hope that we r on right track. It will correct soon and wave C start but where it will take can’t assume. Pl. Guide.

    Reply
    • Ramki on January 22, 2012 10:31 pm

      Hi Salim, The way to make money is to stop hoping for anything. We have to trade our view at critical levels, and with close by stops. It is futile to be running a bad position hoping that your C wave will show up from ever possible resistance level. Good luck

      Reply
  23. Santosh on January 22, 2012 1:42 am

    Hi Ramki,
    If you observe Nifty weekly chart it gives a wave count of A-B-C. that means we are still in corrective zone. Nifty started its wave 3 of wave C somewhere around 9-Dec-2011. In my view medium term target on Nifty is 4400-4000-3800. I dont see Nifty moving above 5100-5180 area as lots of resistance is there. Please suggest/guide as a coach 🙂
    Wave A ends – 31-10-2008 – 6357-2252
    Wave B ends – 5-11-2010 – 2252-6338
    Wave 1 within Wave C ends- 25-11-2011 -6338-4639
    Wave 2 within Wave C ends – 9-12-2011-4639-5099
    Wave 3 within Wave C target – 3732 100%, 3077-161.8%

    Reply
    • Ramki on January 22, 2012 10:33 pm

      Hi Santosh, My first advice as a coach will be to stop being academic. Just about anything is possible. And it is also possible to demonstrate relationships in a myriad ways. Does it serve to help us mae money?

      Reply
      • Santosh on January 22, 2012 11:13 pm

        Thanks Ramki, Yes it help us to make money. i am looking first to learn. I am still not sure whether my wave counts are correct or not on Nifty weekly chart. Just wanted little guidence or advice on it whether they are correct or shall i need to be recount them in other way. can you please tell me atleast they are wrong or correct.

        Reply
        • Ramki on January 23, 2012 5:27 am

          Santosh, you are most welcome. As I often mention in this blog, don’t worry about whether your count is right or wrong. No one will know until after the move. However, make sure you follow the rules and guidelines to come up with your count. At some point you will know you are wrong when one of the rules get violated.

          Reply
          • Santosh on January 23, 2012 7:48 am

            Thanks Ramki, I want to post the charts for which i did elliot wave analysis. I know you dont have much time but can you atleast let me know whether count is correct or not? One word will be sufficient for me (correct or incorrect). I will post the charts with details. the first problem is how to post them on forum? Also can you please help me on how to judge whether the wave has ended or not using elliot oscillator and RSI or any other tool. Please tell me where i can get this information. I have searched so many websites for this. Thanks in advance..

          • Ramki on January 25, 2012 4:00 am

            HI Santosh, Your best bet for now is the forum where others could partcipate in a discussion. One day, if I give a seminar in your part of the world, or if I write another book, we will go into those areas! Best wishes

  24. ankur aditya on January 22, 2012 9:32 pm

    Dear Ramki Sir,
    Pls correct me if i m wrong, as wave 3 was to be ended somewhere around 5020 ie at 161.8% level. But now as it trading well above that then should we consider it as it is extending? Pls reply

    Reply
    • Ramki on January 22, 2012 10:50 pm

      Hi Ankur, your understanding is correct

      Reply
  25. ankur aditya on January 22, 2012 11:07 pm

    Ramki Sir,

    One more query pls. we r travelling in a wave 3 if it corrects down to somewhere around 4920-30 then can it be treated as a internal wave 4 inside of major wave 3? If it is so, then wave 4 and wave 5 will yet to unfold its move which will probably take NSE to reasonable distance around 5300. As i m new to this forum and trying to learning wavecounts after reading from your master peice. Pls throw some light on my query……

    Reply
    • Ramki on January 23, 2012 5:25 am

      HI Ankur,
      As of now it is still uncertain if this is an extending 3rd or a C wave. If itis a 3rd wave, we will go up again. But if we get an overlap of wave 1, it comes down all the way. So I would not try to buy for the 5th wave given this uncertainty.

      Reply
  26. raj kumar ghosh on January 22, 2012 11:32 pm

    sir,
    if i consider third zigzag,
    A = 5382-4531 =
    B = 4531 – 5132

    then A.1 = 5382 — 5202 = 180
    A.2 =5202 — 5325 = 123 App. 61.8% of A.1
    A.3 = 5325 — 4640 = 625 App 350 % of A.1
    A.4 = 4640 — 5100 = 460 .73% OF A.3
    A.5 = 5100 — 4531 = 569 .786% of price projection of 0 to 3 from 4
    A.5 also 423.6% price projection of 0 to 1 from 2

    then wave B .707% of WAVE A IS 5132

    I think market should stop @5058 if not then topout will be around 5150 level.
    SIR , IS MY ANALYSIS VALID AS PER EWP RULE.

    Reply
    • Ramki on January 23, 2012 5:28 am

      Hello Raj Kumar, May I suggest that you post in the Forum so others can reply. Thanks

      Reply
  27. KARTHIK on January 23, 2012 10:28 am

    Sir, Good evening, any new updates on NIFTY based on todays chart.
    Still that move towards 4900 possible?

    Thanks.

    Reply
  28. ankur aditya on January 23, 2012 9:34 pm

    Ramki Sir,

    Wave 1 means 4798.29 ie 78.6% retracement which u have demonstrated on your charts??

    Reply
  29. Pankaj on January 24, 2012 3:23 am

    Ramki sir,
    I am waiting for the corrective channel to break and then move outside along the channel for a 4th wave and then move up to 5400 for a 5th wave. If that happens the plan is to wait for a 3 wave decline(50%) to add on the long side, probably budget effect. Any pointers on how to keep managing the risk while i keep adding and what will be the early signals that will indicate that we are just in a large ABC where A completed at 4540?

    Reply
    • Ramki on January 25, 2012 3:58 am

      Hi Pankaj, Apologies dear friend, but there are so many counts floating around that it is best for you to post on the forum and discuss with line-minded Elliott Wave fans. Good luck. Once again, I am sorry but my current responsibilities make it hard to go beyond this at present!

      Reply
  30. Manohar on January 24, 2012 4:58 am

    Sorry. Wave 1 and wave 3 of minor waves are not equality. wave 3 exceeds wave1. But still minor wave5 is equal to length of 0-3 .
    The only problem is if it goes up from here again the count gets revisiting.
    If the count holds we may see 4930 level for wave 4 in a complex correction.
    Ramki sir, Please comment on the both of the posts.

    Reply
    • Ramki on January 25, 2012 3:57 am

      HI Manohar, please post your counts on the forum so others can discuss with you. I am personally no longer that bearish.

      Reply
  31. raj kumar ghosh on January 25, 2012 1:52 am

    wave count from 4588
    wave 1= 4588 – 4782 = 194
    wave 2= 4782 – 4687 = 95 .50% of w1
    wave 3= 4687 – 4899 = 212 app. 100% w1
    wave 4= 4899 – 4827 = 72 app. 38.2 % w3
    wave 5= 4827 – 5166 = 339

    wave 0 to wave 3 = 4588 – 4899 = 311

    tg for wave 5 is

    62% of wave 0-3 = 5020
    161% of wave 1 = 5141

    i think the impulse wave started from 4588 has ended at today’s high 5166.
    also coincide with .707% retracement level from 5400(5382) to 4531.

    Reply
    • Ramki on January 25, 2012 3:55 am

      Hi Raj, Your own counts will be interesting to readers of the Elliott Wave Forum. Do post there. Thanks

      Reply
  32. R BHANJA on January 25, 2012 5:24 am

    Elliott rule says that wave-4 will not enter into wave-1 territory. But in future markets this rule seems to be violated but very briefly (i.e. ver small amount and also for 1 day only). You may check the NIFTY future market data and cash market data.
    Is it possible or the data needs some filtration?

    Reply
    • Ramki on January 25, 2012 10:52 am

      Bhanja, the rule applies to every market!

      Reply
      • Ashish Gupta on January 26, 2012 8:51 pm

        Hi,

        I am a full time professional trader and used to religiously follow elliott wave theory when I was a beginner / amateur. I have also been following this blog post from time to time but never commented before.

        As a beginner it is very easy to succumb to vulnerabilities of elliott wave theory believing that market will behave in certain manner as prescribed by the underlying theory. But it is also necessary to understand the mechanics of the market, that is demand and supply and the influence of these two forces on the prices. This can of course only be learnt the hard way by trading in markets and often making losses. Elliott wave theory to an experienced trader like me is only an odds enhancer when in doubt on the holding of a major support resistance or support levels and reaction thereof (stop losses etc.).

        It is also necessary to understand the mechanics of the security being traded before applying the elliott wave theory principles. In this case, where we are arguing if wave 1 can enter into territory of wave 4, that is possible in case of Futures. Because futures is a derivative instrument used for speculative purposes and so rules prescrbed by elliott will be violated very often in futures.

        Elliot wave theory therefore should not be applied in futures market and any other instrument that is of derivatives in nature.

        Thanks,

        Ashish

        Reply
  33. Vijay on January 25, 2012 5:36 am

    Sir,
    Humbly requesting you to update with levels and help to get out of the trap.

    Thanks,
    Vijay

    Reply
    • Ramki on January 25, 2012 10:51 am

      Hi vijay, there is some resistance at 5193 and 5238. Let’s hope it comes off a bit from there to allow you to exit. Always keep a close by stop, so you can get back in the game

      Reply
  34. salimkabani on January 25, 2012 12:09 pm

    sir,
    Agree with the view that nifty is no longer bearish as it reached @5100+ which was its last high. My first target is 5650 i.e. 61.8% retracement of 6399-4531. Final target is 8630. Pl. Guide.

    Reply
    • Ramki on January 31, 2012 10:11 pm

      Hi Salim, There are various possible targets depending on how you choose to count the waves. The more important aspect of this exercise is how you are going to use your analysis. Now that you have established some targets, where will you buy and where will your stops be? Please dont post your answers here, just be aware that it is OK to have your own counts, so long as you are following the techniques you learned in my book. You could make money even if you have the opposite view of WaveTimes, for instance! Good luck.

      Reply
  35. R BHANJA on January 26, 2012 12:45 am

    Sir … If a stock/index traded in both cash and future markets, then there will be two different quotes in the two different markets. My question is that will they have to follow the same wave nomenclatures (names) at any time or is to possible to have different wave nomenclatures at any time. For example, NIFTY has two quotations on any day as traded in cash and future markets. Suppose, cash market data require wave numbering of 1, 2, 3, 4 (5-3-5-3 waves) for a move at a time , the is it necessary to assign the same wave numbers (wave-1, 2, 3, 4) to the future market data for the same time even if there is some violations of rules in future market data. Can I assign wave numbers as a-b-c-x (5-3-5-3) to the future market data if wave-1,2,3,4 classification is violated.

    Reply
    • Ramki on January 26, 2012 2:58 am

      Bhanja, I would approach the two markets independently, each with ots own count. I suppose you wish to trade any one only at a time. And as I have often said here before, it is ok to have your own count, so long as you know you are followijng the rules and guidelines of EWP.(This has been covered in my book). At some point your count will breakdown. At that time you re-assess.

      Reply
  36. rrekhani on January 26, 2012 2:00 am

    Nifty above 200 EMA, and targeting 200 SMA above 5200 (the crucial level). Don’t you feel the worst is over?

    Reply
    • Ramki on January 26, 2012 2:59 am

      HI Rekhani, as i said before I am no longer bearish. Will be looking at the next correction to determine whatis a low risk buy level

      Reply
  37. Bharat on January 26, 2012 3:41 am

    Ramki sir,

    I have recently bought your Five waves book…my confusion while reading the same is how to calculate 70.7% of fibonacci, can you please explain.
    PS : My software allows me to see the 61.8% & 78.60% not 70.7%.

    Reply
    • Ramki on January 31, 2012 10:22 pm

      Hi Bharat, If your software cannot do that, you can compute it manually. Suppose the low is 23 and the high is 87, then the distance traveled is (87-23 =) 64. Using a calculator, 70.7% of that move is 64*70.7% = 45.25. So the retracement is 87 minus 45.25 =41.75

      Reply
  38. sam on February 2, 2012 11:40 am

    Hello sir

    today nifty hit 261.8% of wave 1.I think wave 3 ended here.automatically bad news coming from india also world…

    Reply
  39. Ashutosh on February 3, 2012 6:59 pm

    Resp. Sir;
    Here is my point of view; 4532 to 4800 – wave 1
    4800 to 4588 – wave 2
    4588 to 5217 – wave 3 extended
    5217 to 5076 – wave 4
    As the wave 3 being an extended wave,wave 5 should be an equality with wave 1(inclusive) ? If so, then 5400 seems to be the target for the wave 5 ! And then we are going to have an ABC which may drag down Nifty to at least 4800 levels. Please comment.

    Reply
    • Ramki on February 7, 2012 5:57 am

      Ashutosh, you were on the right track, but now that it has gone past equality, lookout for 5500. I suggest you use the forum if you want to discuss your counts with others, as I am usually very busy. Best.

      Reply
  40. salimkabani on February 4, 2012 1:58 am

    sir
    Share ur views on India Nifty.

    Reply
    • Ramki on February 7, 2012 5:54 am

      I would be not like to sell anything for the time being

      Reply
  41. dipesh shah on February 9, 2012 9:53 pm

    Sir,
    Your comments required on the wave counts
    it is said that lots of triangles occur when were nearing a top and that is what seems to be occuring in the hourly and 10 min charts also if 4532 is the bottom and we are in a new bull trend what is the alternate count to it. As a Alternate does this count stand valid where in
    Nifty top 6338
    wave A 4720
    Wave B is (3-3-5) 4720 TO 5400 TO 4532 To the high it makes in the current rally
    Wave C is new lows in 2012 This is just an alternate count but would love to have your views on it

    Reply
    • Ramki on February 13, 2012 3:48 am

      Dipesh, please read my reply to Stani on the EUR

      Reply
  42. salimkabani on February 13, 2012 10:18 am

    Sir,
    I expect nifty may reach 5561 and than correct which may be new low around 3900 in 2012 like EUR/USD or make new high around 8630.
    Please guide.

    Reply
    • Ramki on February 13, 2012 8:04 pm

      Hi Salim, just about anything could happen. But let’s start with your view of 5560 first. If you are able to trade that move well, you are already very successful. Five waves to financial freedom book would help you improve your chances of success. Good luck

      Reply
  43. salimkabani on February 17, 2012 8:11 am

    Sir,
    Nifty has crossed 5560 and touched to 5606 higher than my expectation. Please guide on this issue and share ur views.
    Thanks

    Reply
    • Ramki on February 17, 2012 9:49 pm

      Hi Salim, epext some resistance at 5650.

      Reply
      • salimkabani on February 19, 2012 6:43 am

        Sir,
        Today, I go through ur book purchased from Infibeam.com ‘Five Waves to Finanical Freedom’ but i could not find out the solution for wave counts in respect of Nifty and Banknifty.
        It has already crossed 3.618% of wave 1 and touched to 5606. As per ur expectation, there will be some resistance at 5650 but I can not count clearly.
        Kindly guide on this issue.
        Thanks

        Reply
  44. abhinavjain on February 17, 2012 8:19 am

    Sir, Pls post your latest count on nifty, Wave 3 is extension is going on and on…..
    Just a question is this new bull trend arising or just a bearmarket trap rally…
    How to differentiate in this that is new bull trend or bear trap rally…

    Reply
    • Ramki on February 17, 2012 9:53 pm

      Abhinav, if you go back and read all the comments, you will see that I had said way back that I was no longer bearish. A bear trap is when it briefly goes above a resistance and comes right back after executing stops. Go back to my book and read about reflex points for more information.

      Reply
  45. salimkabani on February 18, 2012 11:15 am

    sir
    If possible, share ur views on bank nifty.
    Thanks

    Reply
    • Ramki on February 20, 2012 2:40 am

      Hello Salim, Thanks for your comment. (a) No two waves can ever be similar. (b) the book gives you a solid introduction to Elliott Waves. Then it comes down to practice! (c) please consider joining the ELliott Wave Forum and discuss with other members. They will be happy to guide you too.

      Reply
  46. merc9000 on February 20, 2012 5:49 am

    Assuming wave 1 started at 4531 ( ie point zero), wave 3 ended at 5606, wave 3 -point 0 equals
    1075. we use 0.382 of this distance to be addedto wave 4 to get 5th wave target. Am I correct?

    Reply
    • Ramki on February 20, 2012 8:35 am

      Merc000! You are right.

      Reply
  47. SONI HITESHKUMAR MAHESHCHADRA on February 20, 2012 10:05 am

    Resp. Sir;
    Here is my point of view
    4531.8 to 4787 – wave 1
    4787 to 4588.15 – wave 2
    4588.15 to 5767 (461.8% Proj. lvl of wave 1) extended wave 3 trg.
    5767 to 5477 – wave 4 trg. (23.6 % of 0-3 wave)

    am i right sir or not ?
    Please comment.

    Reply
    • Ramki on February 22, 2012 1:31 am

      Hi Soni
      May I suggest you use the Forum to discuss with other members your count? I have thousdands of readers and they all have counts on different currencies/stocks/commodities. Unfortunately, I am unable to read and check all their counts. Best wishes.

      Reply
      • Pradeep Singh on February 23, 2012 5:33 am

        sir,, how to join your forum
        i am new to u.
        few days back i bought ur book
        and am reading now

        Reply
        • Ramki on February 23, 2012 7:15 am

          Hello Pradeep, There is a link for the Forum in the menu bar above. Click on it and register. Good luck with EWP. I hope the book helps you too.

          Reply
  48. LALIT SHAHDADPURI on February 24, 2012 6:49 am

    CAN U SUGGEST WHERE CAN I GET YOUR BOOK & WHICH WAY WE R GOING NOW

    Reply
    • Ramki on February 25, 2012 9:17 pm

      Hi lalit, click on the image of the book to the right and follow the guidelines there. Best

      Reply
  49. prithvi on March 2, 2012 10:38 am

    Dear Ramki sir,

    As per ur guideline i had purchased ur book and now i had count the wave,please
    take a look (is i m going right or wrong) please guide me sir.

    Please sir guide me is my count is right or wrong?

    Reply
    • Ramki on March 3, 2012 10:38 am

      Hi Prithvi
      Thanks for your comments. May I recommend that you post your counts on the forum so other Elliott Wave fans can share their thoughts with you? Regards

      Reply

Leave A Reply Cancel Reply

Recent Posts
  • Has Meta (Facebook) stock seen the bottom
  • What Is The Nearest Technical Support For Meta (NASDAQ: FB)
  • Using Elliott Waves to Capture a Trade in S&P500
  • Hedge Funds and Elliott Waves – Netflix $NFLX
  • When Elliott Waves applauds the promoter’s signals!

WaveTimes is a Research Organization dedicated to providing original analysis, reports, reviews, and insights on developments in mutual funds, stocks, investing, foreign exchange, commodities, and bonds.

Contact WaveTimes

L-601 Mantri Espana,

Kariyammana Agrahara, Bellandur, Bangalore 560103

Follow Us

  • Facebook
  • YouTube
  • Twitter

© 2023 Wave Times. All Rights Reserved.
  • About
  • Books
  • Privacy Policy
  • Policies and Standards

Type above and press Enter to search. Press Esc to cancel.