• About
  • Elliott Waves
    • Elliott Waves Explained
    • Elliott Wave Magic Illustrated with Wave Charts
    • Elliott Wave Edge – How Elliott Wave Traders Win
    • Fibonacci Number Series and Elliott Waves
    • How to use Fibonacci Ratio Retracements
    • Elliott Wave Books
      • The Elliott Wave Book – Five Waves to Financial Freedom
      • Dividend Growth Investing Using Elliott Waves
    • Videos
  • Equities
    • Indices
      • Africa
        • Egypt
      • Australia
      • European Indices
        • AEX – Index, Amsterdam
        • DAX Index
        • Istanbul
        • Russia
        • Spain’s IBEX 35
      • Asian Indices
        • India
        • China
        • Dubai
        • Kuwait
        • Kuala Lumpur
        • Pakistan
        • Saudi
        • Taiwan
      • US Indices
        • S&P500
        • Nasdaq
        • Dow Jones
        • Dow Jones Utilities
    • Stocks
      • Asian Stocks
        • Indian Stocks Trading
        • Dubai Stocks Outlook
        • Japanese Stocks
        • Kuwait stocks
        • Saudi Stocks Outlook
      • African Stocks
        • Egyptian Stocks
      • Swiss Stocks
      • Australian Stocks
      • European Stocks
      • US Stocks outlook
      • UK Stocks
  • Commodities
    • Copper
    • Gasoline
    • Gold
    • Natural Gas
    • Oil
    • Palm Oil
    • Raw Sugar
    • Rubber
    • Soybean Oil
    • Silver
  • Forex
    • AUD
    • Bitcoin
    • CAD
    • CHF
    • Euro
    • GBP
    • INR
    • NZD
    • JPY
  • Raves
  • Consulting
    • Consulting
  • Ramki’s Watchlist
Top News

Has Meta (Facebook) stock seen the bottom

March 21, 2022

What Is The Nearest Technical Support For Meta (NASDAQ: FB)

February 7, 2022

Using Elliott Waves to Capture a Trade in S&P500

January 27, 2022
Facebook Twitter Instagram
WaveTimes Blog WaveTimes Blog
Wave times
  • About
  • Elliott Waves
    • Elliott Waves Explained
    • Elliott Wave Magic Illustrated with Wave Charts
    • Elliott Wave Edge – How Elliott Wave Traders Win
    • Fibonacci Number Series and Elliott Waves
    • How to use Fibonacci Ratio Retracements
    • Elliott Wave Books
      • The Elliott Wave Book – Five Waves to Financial Freedom
      • Dividend Growth Investing Using Elliott Waves
    • Videos
  • Equities
    • Indices
      • Africa
        • Egypt
      • Australia
      • European Indices
        • AEX – Index, Amsterdam
        • DAX Index
        • Istanbul
        • Russia
        • Spain’s IBEX 35
      • Asian Indices
        • India
        • China
        • Dubai
        • Kuwait
        • Kuala Lumpur
        • Pakistan
        • Saudi
        • Taiwan
      • US Indices
        • S&P500
        • Nasdaq
        • Dow Jones
        • Dow Jones Utilities
    • Stocks
      • Asian Stocks
        • Indian Stocks Trading
        • Dubai Stocks Outlook
        • Japanese Stocks
        • Kuwait stocks
        • Saudi Stocks Outlook
      • African Stocks
        • Egyptian Stocks
      • Swiss Stocks
      • Australian Stocks
      • European Stocks
      • US Stocks outlook
      • UK Stocks
  • Commodities
    • Copper
    • Gasoline
    • Gold
    • Natural Gas
    • Oil
    • Palm Oil
    • Raw Sugar
    • Rubber
    • Soybean Oil
    • Silver
  • Forex
    • AUD
    • Bitcoin
    • CAD
    • CHF
    • Euro
    • GBP
    • INR
    • NZD
    • JPY
  • Raves
  • Consulting
    • Consulting
  • Ramki’s Watchlist
WaveTimes Blog WaveTimes Blog
Home » The Power of Elliott Waves illustrated
Indian Stocks Trading

The Power of Elliott Waves illustrated

RamkiBy RamkiFebruary 14, 20198 Comments2 Mins Read
Facebook Twitter LinkedIn Telegram Pinterest Tumblr Reddit WhatsApp Email
Share
Facebook Twitter LinkedIn Pinterest Email

Every few days I am reminded of the power of Elliott Waves. Illustrated below is how I anticipated a down move of at least 20% in an Indian Stock.

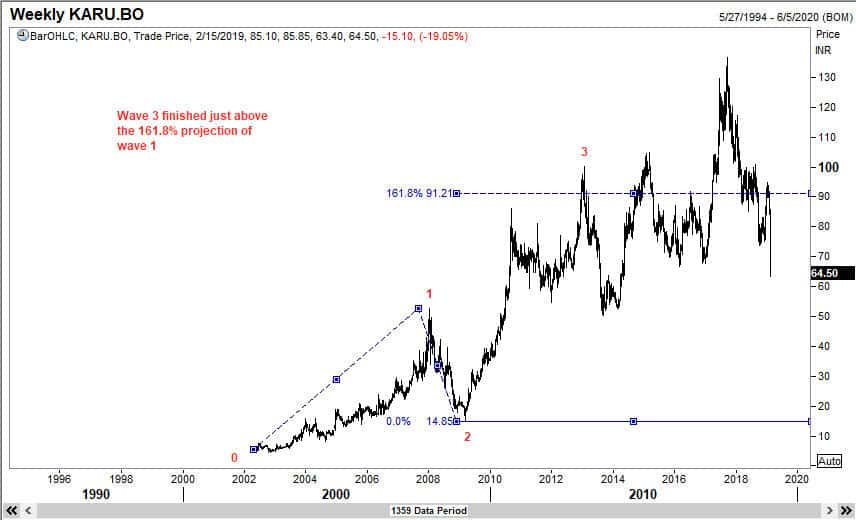
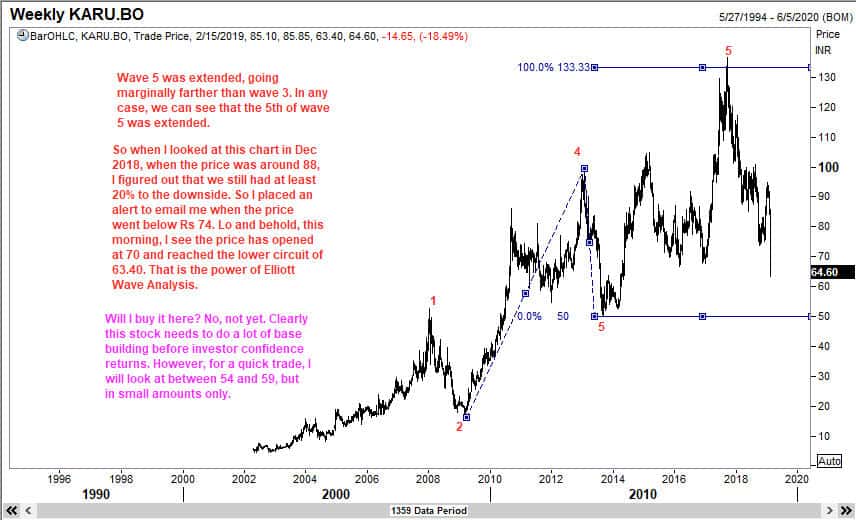
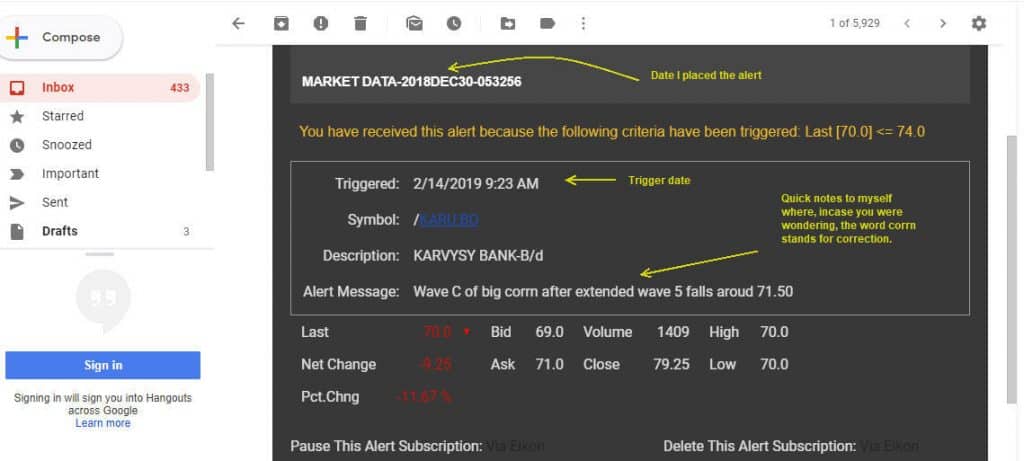
You would remember from my Elliott Wave book “Five Waves to Financial Freedom” that when a fifth wave extends, the correction that follows often tests the sub wave 2 with that fifth wave, and quite regularly goes even lower to reach the prior wave 4 low. On 30th December 2018, when I looked at Karur Vysya Bank stock for a client, I saw the portends of a further sell off. Already the stock had come down from its September 2017 high on 136.54 to around Rs 74 by October 2018, a move of over 45%. The recovery back to its then current levels of around Rs88 seemed part of a correction. So I placed an alert of my Thomson Reuters Eikon system to email me when the stock breaks its prior lows of Rs 74, so that I can evaluate how much lower the stock can go. See this email I received today.

Below are a couple of more charts to help you see how I look at the waves!

First, you identify the end of wave 3
Then you figure out where wave 5 could end

Share. Facebook Twitter Pinterest LinkedIn Tumblr Telegram Email
Previous ArticleRamki’s next Elliott Wave Workshop at Pune on 9 March 2019
Next Article How to effectively use the power of Elliott Waves in your trading?
Ramki
  • Website

Related Posts

When Elliott Waves applauds the promoter’s signals!

January 3, 2022

A soft quarter for TCS – Avoid or Add – Contd.

October 13, 2021

A soft quarter for TCS — Avoid or add?

October 12, 2021
View 8 Comments

8 Comments

  1. Prabh Singh on February 16, 2019 10:43 am

    Hello Ramki,

    Only issue with above Wave counts is that Wave 4 is entering into territory of Wave 1 which is one of the key principle of Elliot wave nicely explained in your books and here it seems that rule getting violated.What are your thoughts for same?

    Reply
    • Ramki Ramakrishnan on February 18, 2019 3:14 am

      Prabh, You are right in your observation. One could also say that the so-called wave 5 looks to be in 3 waves. What matters at the end of it all is how we deal with price. But that does not mean we can allow the rules to be flouted when it suits us. This particular case will remain a mystery for me, and will have to be marked as a suspect.

      Reply
  2. Kannan on April 14, 2019 3:09 pm

    Hello Ramki,

    I have small query on counting. Can we count the Sep’10 high as the wave 3 and Jan’13 as Wave 5 and the correction after that till Aug’13 as the ABC correction completing the cycle and the next set of 5 waves starting from Aug’13 to Sep’17.

    Is there any mistake in the way I do this counting.

    Reply
    • Ramki Ramakrishnan on April 16, 2019 5:23 am

      Kannan, Wave counts are the means to an end, which is to be profitable. My workshop will go deeper into this aspect

      Reply
  3. Udit on May 5, 2019 4:18 am

    Sir on trading view.com this chart is different. Plz check it.

    Reply
    • Ramki Ramakrishnan on May 11, 2019 12:26 pm

      Udit, Thank you but I have no control over the data whether it is from Thomson Reuters or from Trading View of any other website. This free blog exists to help traders learn Elliott Waves! So the concepts are more important. All the best.

      Reply
  4. karan sarna on June 12, 2019 6:30 am

    Hello Sir,

    I got inspired from you to learn Elliot wave and trying to understand.. first found in charts about LTfinance (larsen and tourbo finanace) , I have seen the monthly charts of since 2012 when company is listed and noticed that this share is in wave 4 and completing their correction, Could you please check that am I on right track…Thanks in advance sir

    Reply
    • Ramki Ramakrishnan on August 23, 2019 5:37 am

      Hello Karan, Thank you for your message. Unfortunately I am unable to do what you requested because I get too many such requests.All the best

      Reply

Leave A Reply Cancel Reply

Recent Posts
  • Has Meta (Facebook) stock seen the bottom
  • What Is The Nearest Technical Support For Meta (NASDAQ: FB)
  • Using Elliott Waves to Capture a Trade in S&P500
  • Hedge Funds and Elliott Waves – Netflix $NFLX
  • When Elliott Waves applauds the promoter’s signals!

WaveTimes is a Research Organization dedicated to providing original analysis, reports, reviews, and insights on developments in mutual funds, stocks, investing, foreign exchange, commodities, and bonds.

Contact WaveTimes

L-601 Mantri Espana,

Kariyammana Agrahara, Bellandur, Bangalore 560103

Follow Us

  • Facebook
  • YouTube
  • Twitter

© 2023 Wave Times. All Rights Reserved.
  • About
  • Books
  • Privacy Policy
  • Policies and Standards

Type above and press Enter to search. Press Esc to cancel.