• About
  • Elliott Waves
    • Elliott Waves Explained
    • Elliott Wave Magic Illustrated with Wave Charts
    • Elliott Wave Edge – How Elliott Wave Traders Win
    • Fibonacci Number Series and Elliott Waves
    • How to use Fibonacci Ratio Retracements
    • Elliott Wave Books
      • The Elliott Wave Book – Five Waves to Financial Freedom
      • Dividend Growth Investing Using Elliott Waves
    • Videos
  • Equities
    • Indices
      • Africa
        • Egypt
      • Australia
      • European Indices
        • AEX – Index, Amsterdam
        • DAX Index
        • Istanbul
        • Russia
        • Spain’s IBEX 35
      • Asian Indices
        • India
        • China
        • Dubai
        • Kuwait
        • Kuala Lumpur
        • Pakistan
        • Saudi
        • Taiwan
      • US Indices
        • S&P500
        • Nasdaq
        • Dow Jones
        • Dow Jones Utilities
    • Stocks
      • Asian Stocks
        • Indian Stocks Trading
        • Dubai Stocks Outlook
        • Japanese Stocks
        • Kuwait stocks
        • Saudi Stocks Outlook
      • African Stocks
        • Egyptian Stocks
      • Swiss Stocks
      • Australian Stocks
      • European Stocks
      • US Stocks outlook
      • UK Stocks
  • Commodities
    • Copper
    • Gasoline
    • Gold
    • Natural Gas
    • Oil
    • Palm Oil
    • Raw Sugar
    • Rubber
    • Soybean Oil
    • Silver
  • Forex
    • AUD
    • Bitcoin
    • CAD
    • CHF
    • Euro
    • GBP
    • INR
    • NZD
    • JPY
  • Raves
  • Consulting
    • Consulting
  • Ramki’s Watchlist
Top News

Has Meta (Facebook) stock seen the bottom

March 21, 2022

What Is The Nearest Technical Support For Meta (NASDAQ: FB)

February 7, 2022

Using Elliott Waves to Capture a Trade in S&P500

January 27, 2022
Facebook Twitter Instagram
WaveTimes Blog WaveTimes Blog
Wave times
  • About
  • Elliott Waves
    • Elliott Waves Explained
    • Elliott Wave Magic Illustrated with Wave Charts
    • Elliott Wave Edge – How Elliott Wave Traders Win
    • Fibonacci Number Series and Elliott Waves
    • How to use Fibonacci Ratio Retracements
    • Elliott Wave Books
      • The Elliott Wave Book – Five Waves to Financial Freedom
      • Dividend Growth Investing Using Elliott Waves
    • Videos
  • Equities
    • Indices
      • Africa
        • Egypt
      • Australia
      • European Indices
        • AEX – Index, Amsterdam
        • DAX Index
        • Istanbul
        • Russia
        • Spain’s IBEX 35
      • Asian Indices
        • India
        • China
        • Dubai
        • Kuwait
        • Kuala Lumpur
        • Pakistan
        • Saudi
        • Taiwan
      • US Indices
        • S&P500
        • Nasdaq
        • Dow Jones
        • Dow Jones Utilities
    • Stocks
      • Asian Stocks
        • Indian Stocks Trading
        • Dubai Stocks Outlook
        • Japanese Stocks
        • Kuwait stocks
        • Saudi Stocks Outlook
      • African Stocks
        • Egyptian Stocks
      • Swiss Stocks
      • Australian Stocks
      • European Stocks
      • US Stocks outlook
      • UK Stocks
  • Commodities
    • Copper
    • Gasoline
    • Gold
    • Natural Gas
    • Oil
    • Palm Oil
    • Raw Sugar
    • Rubber
    • Soybean Oil
    • Silver
  • Forex
    • AUD
    • Bitcoin
    • CAD
    • CHF
    • Euro
    • GBP
    • INR
    • NZD
    • JPY
  • Raves
  • Consulting
    • Consulting
  • Ramki’s Watchlist
WaveTimes Blog WaveTimes Blog
Home » The Gold Rush- Elliott Wave Route
Gold

The Gold Rush- Elliott Wave Route

RamkiBy RamkiJuly 10, 20118 Comments2 Mins Read
Facebook Twitter LinkedIn Telegram Pinterest Tumblr Reddit WhatsApp Email
Share
Facebook Twitter LinkedIn Pinterest Email

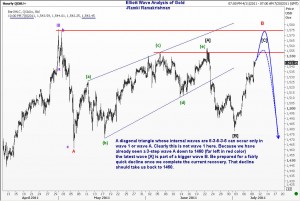
In my most recent update on Gold, I shared with you two charts that were prepared for a friend in the Far East. Some careful readers noted that I was calling for one more rally after we dipped to 1460. The rally has developed from around 1478, and is looking strong even now. So strong that we shouldn’t be surprised if it reaches the old high near 1574. Having said that, I am going out on a limb and suggesting that we will get one more rapid decline towards 1460 once we finish the current ascent. I sometimes wonder why on earth should I make these announcements publicly because of the obvious risk of being so very wrong. (Just today someone showed me a report with the title “In Gold We Trust” and saying we will see $2000). Well, in its current avatar, Wavetimes is not a forecasting service. It is my personal blog with the specific objective of connecting with people who wish to learn and trade the markets using Elliott Wave Analysis. Coming back to Gold, we should be careful about the levels we pick to sell. Ideally, wait for the markets to pause and turn down a little. Then when it attempts a slow move higher, sell with a stop above the high seen. Ofcourse you will see many levels where it pauses. So be patient until it reaches a technical target, such as the prior high, and then try the above described strategy. If ot works, it will be fun! If it doesn’t, you would escape with minor scratches, and no broken bones. Good luck.

Gold
Share. Facebook Twitter Pinterest LinkedIn Tumblr Telegram Email
Previous ArticleIndia's NSEI outlook
Next Article EUR/USD example of Elliott Wave Analysis
Ramki
  • Website

Related Posts

Elliott Wave analysis benefits a short term trader in XAU/USD

June 9, 2017

Elliott Wave Analysis of Gold

April 16, 2013

Elliott Wave Analysis of Gold – September 2012

September 9, 2012
View 8 Comments

8 Comments

  1. Ahmed Farghaly on July 11, 2011 4:27 pm

    Dear Ramki,

    I notcied in your reading recommendations you’ve listed Balan Robert’s Elliott wave Applied to the foriegn exchange markets. I have a question for you. Do you believe in the part of substitutions of patterns. Particularly the part where he states the C waves could take the form of deep correction (like double or triple zigzags) and do you believe that an A wave of a zigzag could be a 3 wave structure? (rarely when patterns deviate from the norm in the forex market) If you are convinced of these discoveries do you think it could be applied to the gold market as well or only the forex market? I would appreciate your input on this matter considering you have alof more experience than most In applying this theory for a very long time.
    If I may add as well. In the part of the wave C being a zigzag combination he only illustrated it in terms of an irregular flat. However he failed to illustrate that as part of zigzags in that section of the book. Was he talking specifically about the irregular pattern or C waves in general. Thats if you believe in his findings ofcourse.

    Best Regards,
    Ahmed Farghaly

    Reply
  2. Linda on July 11, 2011 6:49 pm

    Thank you Ramki. I noticed the “III”. So we are in the middle of wave IV and we may see wave V when the c wave of IV finished. I am trying to count waves of silver, and very happy to see your wave counts of Gold. Thank you sir.

    Reply
  3. Sachin Rathi on July 13, 2011 12:02 am

    Sir,

    Now as we reached near $1570-73 mark, can we initiate short here or wait for losing momentum. If any short from here what SL we should place.
    Regards
    Sachin Rathi

    Reply
  4. Ahmed Farghaly on July 14, 2011 5:56 am

    Expanding diagonal wave 5 in progress?

    Reply
  5. mak on July 15, 2011 11:50 pm

    Sir,

    I have recently followed your work. Thanks for your view on different markets. I appreciate if you also update us on silver market. I have seen wave counts predicting low of 27-28 for silver.

    Thanks

    Reply
  6. Ahmed Farghaly on July 18, 2011 4:56 am

    My target cieling for gold is at 1615-1620$, We have numerous Fibonacci clusters at that level, 0.618x wave 1-3 of the advance from 1999 on semi log scale, 0.618x waves 1-3 of the advance from Jan 2011, 1.618x the January 2011 trading range reflected off the Jauary 2011 high (Important resistance for the year) and the Monthly R2-R3 midline for the month of July 2011) if price makes it up there it will most likely get hammered lower. Wouldnt you say that the expanding diagonal seems to be the most accurate count for the final fifth wave of the advance from January 2011 which was minute wave 5 of minor wave 5 of intermediate wave 5 of primary wave 5?! I see us trading at 1460 or bellow in about a month or a month and a half from now due to the time estimate that a diagonal offers.

    Thanks,
    Ahmed Farghaly

    Reply
  7. Rajesh on August 20, 2011 9:47 pm

    Ramki,
    Sir an update on GOLD is required.

    Reply
  8. Yash on August 21, 2011 1:51 am

    RAMKI Sir,

    Gold is pulling all towards a kicking moves on upside. A quick update on Gold is very much necessary that when n where this bull run will stop, or whether is it a more on upside left.., kindly update Gold chart for further movements. As silver is almost reached Wave B now might fall downwards. So if silver falls then what with Gold, Or is it Gold which will pull silver more on upside.

    Kindly Update Sir,

    Thanks n Regards

    Reply

Leave A Reply Cancel Reply

Recent Posts
  • Has Meta (Facebook) stock seen the bottom
  • What Is The Nearest Technical Support For Meta (NASDAQ: FB)
  • Using Elliott Waves to Capture a Trade in S&P500
  • Hedge Funds and Elliott Waves – Netflix $NFLX
  • When Elliott Waves applauds the promoter’s signals!

WaveTimes is a Research Organization dedicated to providing original analysis, reports, reviews, and insights on developments in mutual funds, stocks, investing, foreign exchange, commodities, and bonds.

Contact WaveTimes

L-601 Mantri Espana,

Kariyammana Agrahara, Bellandur, Bangalore 560103

Follow Us

  • Facebook
  • YouTube
  • Twitter

© 2023 Wave Times. All Rights Reserved.
  • About
  • Books
  • Privacy Policy
  • Policies and Standards

Type above and press Enter to search. Press Esc to cancel.