• About
  • Elliott Waves
    • Elliott Waves Explained
    • Elliott Wave Magic Illustrated with Wave Charts
    • Elliott Wave Edge – How Elliott Wave Traders Win
    • Fibonacci Number Series and Elliott Waves
    • How to use Fibonacci Ratio Retracements
    • Elliott Wave Books
      • The Elliott Wave Book – Five Waves to Financial Freedom
      • Dividend Growth Investing Using Elliott Waves
    • Videos
  • Equities
    • Indices
      • Africa
        • Egypt
      • Australia
      • European Indices
        • AEX – Index, Amsterdam
        • DAX Index
        • Istanbul
        • Russia
        • Spain’s IBEX 35
      • Asian Indices
        • India
        • China
        • Dubai
        • Kuwait
        • Kuala Lumpur
        • Pakistan
        • Saudi
        • Taiwan
      • US Indices
        • S&P500
        • Nasdaq
        • Dow Jones
        • Dow Jones Utilities
    • Stocks
      • Asian Stocks
        • Indian Stocks Trading
        • Dubai Stocks Outlook
        • Japanese Stocks
        • Kuwait stocks
        • Saudi Stocks Outlook
      • African Stocks
        • Egyptian Stocks
      • Swiss Stocks
      • Australian Stocks
      • European Stocks
      • US Stocks outlook
      • UK Stocks
  • Commodities
    • Copper
    • Gasoline
    • Gold
    • Natural Gas
    • Oil
    • Palm Oil
    • Raw Sugar
    • Rubber
    • Soybean Oil
    • Silver
  • Forex
    • AUD
    • Bitcoin
    • CAD
    • CHF
    • Euro
    • GBP
    • INR
    • NZD
    • JPY
  • Raves
  • Consulting
    • Consulting
  • Ramki’s Watchlist
Top News

Has Meta (Facebook) stock seen the bottom

March 21, 2022

What Is The Nearest Technical Support For Meta (NASDAQ: FB)

February 7, 2022

Using Elliott Waves to Capture a Trade in S&P500

January 27, 2022
Facebook Twitter Instagram
WaveTimes Blog WaveTimes Blog
Wave times
  • About
  • Elliott Waves
    • Elliott Waves Explained
    • Elliott Wave Magic Illustrated with Wave Charts
    • Elliott Wave Edge – How Elliott Wave Traders Win
    • Fibonacci Number Series and Elliott Waves
    • How to use Fibonacci Ratio Retracements
    • Elliott Wave Books
      • The Elliott Wave Book – Five Waves to Financial Freedom
      • Dividend Growth Investing Using Elliott Waves
    • Videos
  • Equities
    • Indices
      • Africa
        • Egypt
      • Australia
      • European Indices
        • AEX – Index, Amsterdam
        • DAX Index
        • Istanbul
        • Russia
        • Spain’s IBEX 35
      • Asian Indices
        • India
        • China
        • Dubai
        • Kuwait
        • Kuala Lumpur
        • Pakistan
        • Saudi
        • Taiwan
      • US Indices
        • S&P500
        • Nasdaq
        • Dow Jones
        • Dow Jones Utilities
    • Stocks
      • Asian Stocks
        • Indian Stocks Trading
        • Dubai Stocks Outlook
        • Japanese Stocks
        • Kuwait stocks
        • Saudi Stocks Outlook
      • African Stocks
        • Egyptian Stocks
      • Swiss Stocks
      • Australian Stocks
      • European Stocks
      • US Stocks outlook
      • UK Stocks
  • Commodities
    • Copper
    • Gasoline
    • Gold
    • Natural Gas
    • Oil
    • Palm Oil
    • Raw Sugar
    • Rubber
    • Soybean Oil
    • Silver
  • Forex
    • AUD
    • Bitcoin
    • CAD
    • CHF
    • Euro
    • GBP
    • INR
    • NZD
    • JPY
  • Raves
  • Consulting
    • Consulting
  • Ramki’s Watchlist
WaveTimes Blog WaveTimes Blog
Home » The Elusive NSEI 4800!
India

The Elusive NSEI 4800!

RamkiBy RamkiJune 29, 201150 Comments1 Min Read
Facebook Twitter LinkedIn Telegram Pinterest Tumblr Reddit WhatsApp Email
Share
Facebook Twitter LinkedIn Pinterest Email


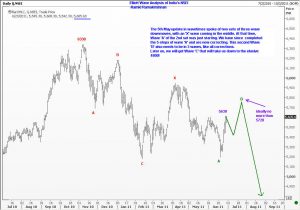
India’s NSEI was cruising along nicely towards 4800 when all of a sudden the brakes were slammed and the index took off in the reverse direction. This has seemingly caught a lot of traders off-guard. Fortunate are the readers of Wavetimes who heeded the warning that the downmove to 4800 will be a 3-step affair.

The 5th May update in wavetimes spoke of two sets of three-wave downmoves, with an ‘X’ wave coming in the middle. At that time, Wave ‘A’ of the 2nd set was just starting. We have since completed the 5-steps of wave ‘A’ and are now correcting. This second Wave ‘B’ also needs to be in 3 waves, like all corrections.
Later on, we will get Wave ‘C’ that will take us down to the elusive 4800!

NSEI outlook NSEI target NSEI wave analysis
Share. Facebook Twitter Pinterest LinkedIn Tumblr Telegram Email
Previous ArticleGBP/USD update
Next Article What is possible with Elliott Wave Analysis!
Ramki
  • Website

Related Posts

How Elliott Waves helped WaveTimes members to exit before the stock market crash

March 27, 2020

How we traded Castrol India using Elliott Waves

December 9, 2019

Nifty rallied up in 5 waves

July 10, 2015
View 50 Comments

50 Comments

  1. abhinavjain on June 29, 2011 8:31 am

    sir one more thing how you reach to level of 5720 i mean is it any retracement level or any thing else pls explain

    Reply
  2. Ashutosh Ghuley on June 29, 2011 9:14 am

    Resp. Sir;
    I am a regular reader of your blogs.You are right here.Can you confirm my view that , apart from Elliott wave counting,are’nt we have an Head n Shoulder pattern?And that will bring down the Nifty to 4800 levels ?

    Reply
    • Ramki on June 29, 2011 11:08 am

      Hi Ashutosh, I don’t see any head and shoulders pattern here in NSEI.

      Reply
  3. zen on June 29, 2011 9:55 am

    Hi, Ramki.
    May I ask what software you are using for charting?
    Thank you.

    Reply
    • Ramki on June 29, 2011 11:09 am

      Hi Zen, I use Reuters charts, but as you can see, one could arrive at the same results even with any of the free charts available in the internet.

      Reply
      • Ramki on June 29, 2011 11:10 am

        Sidarth, My pleasure!

        Reply
  4. Sidharth Sehgal on June 29, 2011 10:26 am

    Dear Sir,
    Thanks for the Update.
    Many like me were waiting for this one.

    Best Regards
    Sidharth Sehgal

    Reply
  5. Jitendra Jaiswani on June 29, 2011 11:22 am

    Ramki Jee
    Thanks A Lot…………………….

    Reply
  6. Rohit on June 30, 2011 2:01 am

    Very clear cut View with little ambiguity.

    Reply
  7. AMIT on June 30, 2011 2:04 am

    Hi Sir,
    Just wanted to ask a query, if we breach 5750 and 5800, still will be a B wave or a A bottom has formed at 5200 on nifty.

    Thanks a lot for your update

    Reply
  8. karthik goel on June 30, 2011 6:30 am

    Ramki could you please confirm whether you have taken the lows from 2008 lows or 2009 as the start of wave 1 and 6338 in Nov 2010 as end of wave 5 ? I am assuming you have taken the upmove from 2009 lows to the high of Nov 2010 (nifty 6338) as the wave 1 of the upmove and currently wave 2 is going on which will end at 4800 or even 4600?

    Reply
  9. Pankaj on June 30, 2011 10:07 pm

    Ramki,
    Thanks for this update!!!.
    Today we have managed to take out 5700 in wave a of B. Does this increase the chance that wave B will end much above 5720.

    Reply
  10. Ashutosh Ghuley on July 2, 2011 4:42 am

    Sir; Yesterday,Nifty spot kissed 5700 levels. That was a gap up opening.According to you,5720 was the target.Is the wave c is complete ?You can see,Nifty has shed 78 points.Is the journey up is over for time being and the journey downward has started,or we will see 5720 or 5748 which is the 200 SMA? Please enlighten us.
    Regards! Ashutosh

    Reply
  11. Ashutosh Ghuley on July 3, 2011 1:18 am

    I have been seeing it right from 23rd June 2011, afternoon 2.30 p.m. If Nifty has accumulated a whole lot of shorts in the last month, which it might have, we should be seeing a wonderful move up to 5950!! Lets see.

    Reply
  12. Vidhan Dugar on July 3, 2011 11:27 am

    Dear Ramki,
    Since banks hold a huge weightage in Nifty , please have a look at Bank Nifty. Logic Says a fall by 20% in Bank nifty can bring a 10% fall in Nifty.Give your views if you find anything interesting in Bank Nifty.
    Vidhan
    Ps in Nifty I am keenly watching 5772 levels (76.4% retracement) . The rally should be over around/before these levels . One should play short via options as they are very cheap.

    Reply
  13. Nirav on July 4, 2011 12:03 pm

    Ramki, nifty has made a high of 5700, do u think we could move higher from this level, if yes what would be the upper band and when that wave ends where could nifty head towards on the down side????

    Reply
    • Pankaj Vijay on July 6, 2011 5:37 am

      Hi Ramki,
      Do you see the current sideways market as a ‘B’ wave within overall bigger B wave? Is it possible that Nifty will go further up here to form a final ‘C’ wave within this bigger B wave? What shall be the target for this C wave?
      Thanks and Regards,
      Pankaj.

      Reply
  14. prithvi on July 7, 2011 2:39 am

    Hi Sir,

    Any Update for Nifty 4800?

    Reply
  15. Keyur on July 7, 2011 3:10 am

    Sir, nifty above 5750. are you still believe in the same counts or any change in counts ?

    Reply
  16. Sam on July 7, 2011 3:19 am

    please review your Elliot wave Count for Nifty , Your Saying Maximum upside is 5720. usually Wave B retrace less than 50% of Wave A.

    Reply
  17. Vidhan Dugar on July 7, 2011 6:38 am

    Fast approaching 5770 levels (76.4%) as suggested earlier. This is the top and the last chance to create shorts.Simply buy 5800 puts

    Reply
  18. BJ on July 7, 2011 6:48 am

    Dear Ramki,

    At what level does one conclude that the WXY may have ended at 5195 in June.

    Best regards,
    BJ

    Reply
  19. Pankaj Vijay on July 7, 2011 9:31 am

    Dear Ramki,

    Today Nifty has given a breakout above 5720 – the initial target identified by us. So will you like to update the wave counts here and redefine the next target please?

    Regards,
    Pankaj.

    Reply
  20. ravi on July 7, 2011 10:05 am

    Hello sir, It seems today’s Nifty move has given room to 100+ points of uptrend. Does this positive bias is going to change the wave count you are anticipating? Please update whenever you feel that reversal is going to happen.

    Thanks,
    Ravi

    Reply
  21. prithvi on July 7, 2011 11:58 pm

    Dear Sir,
    Any Update For Nifty?

    Reply
  22. meena on July 8, 2011 12:35 am

    Hi Sir,
    As guided by you, i am watching only one website wave counts (your website) otherwise i gets confused counting the waves.

    We are in ‘B’ wave should be a,b,c move. As per your analysis 5630 level is “wave a”, and market is consolidated for 3 days and not break below 5600 levels. Shall we consider this low as Wave b? Now market is trading above 5700+; this should be a “wave c” right? After reaching 5800 level, we can expect larger correction right? (Wave C)

    Please explain whether my interpretation is correct or not.

    Meena.

    Reply
  23. Pankaj on July 8, 2011 1:43 am

    Ramki,
    I was comparing banknifty charts to nifty charts. On bank nifty we have a clear 3 wave up ABC (wave 5 ends on may 23). On Nifty we breached the (may 25 lows). If i look at both the charts together….it appears that we have a irregular correction on the nifty and we have completed wave C at 5737 levels. Do you buy into this argument?
    Thanks,
    Pankaj

    Reply
  24. R BHANJA on July 10, 2011 12:25 am

    The current wave-B has moved more than 61.8% of wave-A, which indicates the A-B-C correction after wave-X will be a flat. The trendline break suggest NIFTY may move further up. If it is a flat it may move up to 5950 or more. Alternatively, the current move is the thrust after the wave-e of the expanding triangle (statrting from 6338). If this is so then the current wave may terminate at 5820. Any move beyond beyond 5820 will negate the Expanding Triangle concept. However, if it is ET then the current down trend from 6338 will be a complex one and likely to go more down and time consuming.

    Reply
  25. Ashutosh Ghuley on July 12, 2011 9:07 am

    wow !That’s what happened today.Nifty sought support at 5496.You are simply wonderful,Sir!

    Reply
  26. Ashutosh Ghuley on July 13, 2011 6:17 pm

    If we look at the Nifty chart from 25/01/11 to the present day, does’nt it look like an Head n Shoulder ?

    Reply
    • Ramki on July 13, 2011 10:55 pm

      Asutosh, I am quite bad at spotting head and shoulders formations 🙂

      Reply
  27. Pankaj on July 14, 2011 11:25 pm

    Ramki,
    There does not seem enough selling pressure on nifty to take it down….Nifty sold to 5500 quickly but recovered with equal velocity. What to look when we want to spot selling/buying pressure.. Is it the time taken for the move or is it volume?

    Reply
    • Ramki on July 15, 2011 6:53 am

      Hi Pankaj, you need to know where is the cycle of 8 waves the index is currently in. A knowledge of wave personalities is useful.

      Reply
  28. kanishk on July 22, 2011 5:01 am

    Interesting to see you hold you’re 4800 target for the NIFTY, since Prechters service states that we’re going straight past the all-time high’s of the SENSEX in this wave-up.
    What’s YOU’RE take? Still eventually down?
    Thanks for reading!
    Kanishk

    Reply
    • Ramki on July 24, 2011 3:48 am

      Kanishk, Sidharth, Vidhan and others! I will stick to explaning my charts as a matter of good practice. Understand that it is perfectly possible for different people to have different counts. What matters is how we use a count to trade. We are not trying to see who is correct. Suppose we stick to my counts. Either it is correct, or it is wrong. When it is wrong, there will be some signals, and we need to know what those signals are. I am not going to explain all of that here (hopefully it will figure in the book that is still in my mind!!) But we got a 3 wave downmove from 6338, telling me we are going to move higher again. We then got the X wave, but the downmove from point X (5944 to 5195) was a 5 wave move. That downmove has not been adequately corrcted yet. SO we could still remain fairly well supported during which time a further recovery is possible, violating the 5720. In the BIG picture, though, nothing has happened yet to invalidate the call for a move lower to 4800. Yet, if you are a trader, you probably cannot remain short indefinitely. So plan your entry levels carefully, and take profits when you see some, with the intention to sell again!

      Reply
  29. Sidharth on July 23, 2011 4:25 am

    Dear Sir,

    Kanishk has a valid point to ask ,
    even I read EW report and it says nifty moving to
    All time high now , kindly clarify our doubts.
    Thanks
    Sidharth

    Reply
  30. vidhan on July 23, 2011 5:02 am

    One should take his (Mr P.) views with a bowl of salt since he makes dramatic forecasts and when he is wrong there is no follow up …. he simply disappears

    Reply
  31. Rajesh on August 3, 2011 8:29 am

    Good Job. Nifty heading for 4800. It may pause at 5200 for some time. When is your book coming?

    Reply
    • Ramki on August 3, 2011 8:06 pm

      Hi Rajesh, working on it. Current examples are going into book instead of the blog!

      Reply
      • Rajesh on August 5, 2011 10:07 pm

        Please keep us updating with your valued comments and remarks on present market trends. Thanks.

        Reply
  32. subramanian.s on August 4, 2011 6:49 am

    being in the market as a passive investor for 4 years ,after going through the articles in ur blog which is an eye opener ,very eager to learn elliot waves,pls inform me if u are conducting any seminar in india.

    Reply
    • Ramki on August 4, 2011 11:18 am

      Hi Subra, welcome aboard! In order to conduct a seminar in India I need a sponsor. I’ve started writing a book and hope to make it available in a few months. Best of luck.

      Reply
  33. MANOJ on August 4, 2011 9:14 pm

    The Elusive NSEI 4800! STARTS …………………….SIR

    Reply
  34. Kanishk on August 7, 2011 1:11 am

    Hello Ramki,

    Been following you’e analysis since Dec’10 or Jan’11.

    Just thought I’d mention that I’m actually a subscriber to Rober Prechters Elliot Wave Forecast for the Asian Pacific region & not once since the current rally ended in about Oct’10 or Nov’10 has their strategist predicted that we’d be going to 4800 on the NIFTY.

    Its been a long wait to the bottom as we had quite a few false rallies here & there but you held you’re view right from the start that we’d eventually go down to 4800!!

    Just wanted to check…is that the bottom in you’re opinion? Would 4800 be the bottom to get in for the long haul?

    I’d be happy to start-buying long term since 4900 itself!

    Once again, thanks for you’re time & please keep up the fantastic great work!

    Kanishk

    Reply
    • Ramki on August 7, 2011 1:13 am

      Hi Kanishk, Thank you. Sometimes it works like magic. At other times not so good. We are still some 400 points away from the elusive 4800!

      Reply
  35. Chauhan mufazal on August 7, 2011 6:15 am

    Hi ramki sir.
    As your earlier chart we are on the way to 4800. From 5740.
    congrats. But I lost a little bit on the way.
    Waiting for the release of your book
    thanks

    Reply
  36. Hasit on August 18, 2011 8:34 am

    Sir Nsei Touch 4800 After What ? Your Outlook ?

    Reply
  37. Mani on August 20, 2011 1:29 am

    sir……….fantastic job……..my congratulations….

    Reply
    • Abhilasha on August 21, 2011 7:04 pm

      Kindly post an update on Nifty. Bounce from here or another leg down?

      Reply
  38. pruthvi on August 21, 2011 12:02 am

    Dear Ramki Sir,

    Congratulations abt nifty 4800.
    Now Wt to do?
    Please update your view on nifty and other stock.

    Reply

Leave A Reply Cancel Reply

Recent Posts
  • Has Meta (Facebook) stock seen the bottom
  • What Is The Nearest Technical Support For Meta (NASDAQ: FB)
  • Using Elliott Waves to Capture a Trade in S&P500
  • Hedge Funds and Elliott Waves – Netflix $NFLX
  • When Elliott Waves applauds the promoter’s signals!

WaveTimes is a Research Organization dedicated to providing original analysis, reports, reviews, and insights on developments in mutual funds, stocks, investing, foreign exchange, commodities, and bonds.

Contact WaveTimes

L-601 Mantri Espana,

Kariyammana Agrahara, Bellandur, Bangalore 560103

Follow Us

  • Facebook
  • YouTube
  • Twitter

© 2023 Wave Times. All Rights Reserved.
  • About
  • Books
  • Privacy Policy
  • Policies and Standards

Type above and press Enter to search. Press Esc to cancel.