• About
  • Elliott Waves
    • Elliott Waves Explained
    • Elliott Wave Magic Illustrated with Wave Charts
    • Elliott Wave Edge – How Elliott Wave Traders Win
    • Fibonacci Number Series and Elliott Waves
    • How to use Fibonacci Ratio Retracements
    • Elliott Wave Books
      • The Elliott Wave Book – Five Waves to Financial Freedom
      • Dividend Growth Investing Using Elliott Waves
    • Videos
  • Equities
    • Indices
      • Africa
        • Egypt
      • Australia
      • European Indices
        • AEX – Index, Amsterdam
        • DAX Index
        • Istanbul
        • Russia
        • Spain’s IBEX 35
      • Asian Indices
        • India
        • China
        • Dubai
        • Kuwait
        • Kuala Lumpur
        • Pakistan
        • Saudi
        • Taiwan
      • US Indices
        • S&P500
        • Nasdaq
        • Dow Jones
        • Dow Jones Utilities
    • Stocks
      • Asian Stocks
        • Indian Stocks Trading
        • Dubai Stocks Outlook
        • Japanese Stocks
        • Kuwait stocks
        • Saudi Stocks Outlook
      • African Stocks
        • Egyptian Stocks
      • Swiss Stocks
      • Australian Stocks
      • European Stocks
      • US Stocks outlook
      • UK Stocks
  • Commodities
    • Copper
    • Gasoline
    • Gold
    • Natural Gas
    • Oil
    • Palm Oil
    • Raw Sugar
    • Rubber
    • Soybean Oil
    • Silver
  • Forex
    • AUD
    • Bitcoin
    • CAD
    • CHF
    • Euro
    • GBP
    • INR
    • NZD
    • JPY
  • Raves
  • Consulting
    • Consulting
  • Ramki’s Watchlist
Top News

Has Meta (Facebook) stock seen the bottom

March 21, 2022

What Is The Nearest Technical Support For Meta (NASDAQ: FB)

February 7, 2022

Using Elliott Waves to Capture a Trade in S&P500

January 27, 2022
Facebook Twitter Instagram
WaveTimes Blog WaveTimes Blog
Wave times
  • About
  • Elliott Waves
    • Elliott Waves Explained
    • Elliott Wave Magic Illustrated with Wave Charts
    • Elliott Wave Edge – How Elliott Wave Traders Win
    • Fibonacci Number Series and Elliott Waves
    • How to use Fibonacci Ratio Retracements
    • Elliott Wave Books
      • The Elliott Wave Book – Five Waves to Financial Freedom
      • Dividend Growth Investing Using Elliott Waves
    • Videos
  • Equities
    • Indices
      • Africa
        • Egypt
      • Australia
      • European Indices
        • AEX – Index, Amsterdam
        • DAX Index
        • Istanbul
        • Russia
        • Spain’s IBEX 35
      • Asian Indices
        • India
        • China
        • Dubai
        • Kuwait
        • Kuala Lumpur
        • Pakistan
        • Saudi
        • Taiwan
      • US Indices
        • S&P500
        • Nasdaq
        • Dow Jones
        • Dow Jones Utilities
    • Stocks
      • Asian Stocks
        • Indian Stocks Trading
        • Dubai Stocks Outlook
        • Japanese Stocks
        • Kuwait stocks
        • Saudi Stocks Outlook
      • African Stocks
        • Egyptian Stocks
      • Swiss Stocks
      • Australian Stocks
      • European Stocks
      • US Stocks outlook
      • UK Stocks
  • Commodities
    • Copper
    • Gasoline
    • Gold
    • Natural Gas
    • Oil
    • Palm Oil
    • Raw Sugar
    • Rubber
    • Soybean Oil
    • Silver
  • Forex
    • AUD
    • Bitcoin
    • CAD
    • CHF
    • Euro
    • GBP
    • INR
    • NZD
    • JPY
  • Raves
  • Consulting
    • Consulting
  • Ramki’s Watchlist
WaveTimes Blog WaveTimes Blog
Home » The Elliott Wave Edge for traders in Sangamo Therapeutics Inc
US Stocks outlook

The Elliott Wave Edge for traders in Sangamo Therapeutics Inc

RamkiBy RamkiDecember 18, 20177 Comments4 Mins Read
Facebook Twitter LinkedIn Telegram Pinterest Tumblr Reddit WhatsApp Email
A three wave correction is over
Share
Facebook Twitter LinkedIn Pinterest Email

You have seen hundreds of real-life examples in WaveTimes that illustrate the edge that Elliott Wave analysis offers traders. Here is one more example of that edge, in the form of an idea that I had shared with members of the exclusive club some seven months ago.

Sangamo Therapeutics, Inc., formerly Sangamo BioSciences, Inc., is a clinical-stage biotechnology company. The Company is focused on translating science into genomic therapies that transform patients’ lives using the Company’s platform technologies in genome editing, gene therapy, gene regulation and cell therapy.

The first Elliott Wave chart below shows Sangamo Therapeutics Inc has completed a three-wave correction below the $3 level, following which we saw a sharp rally. This was the first clue that made me take notice of this stock.


A three wave correction is over

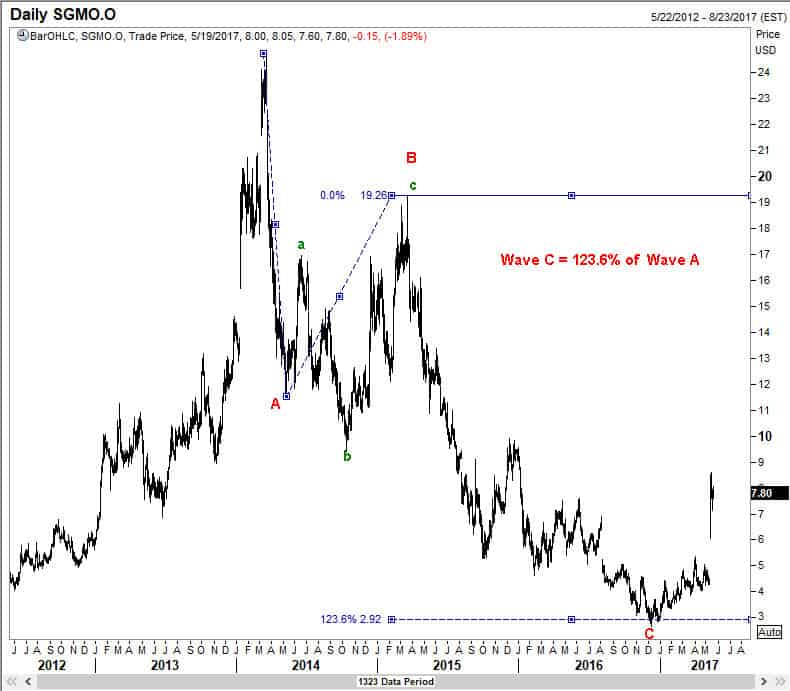
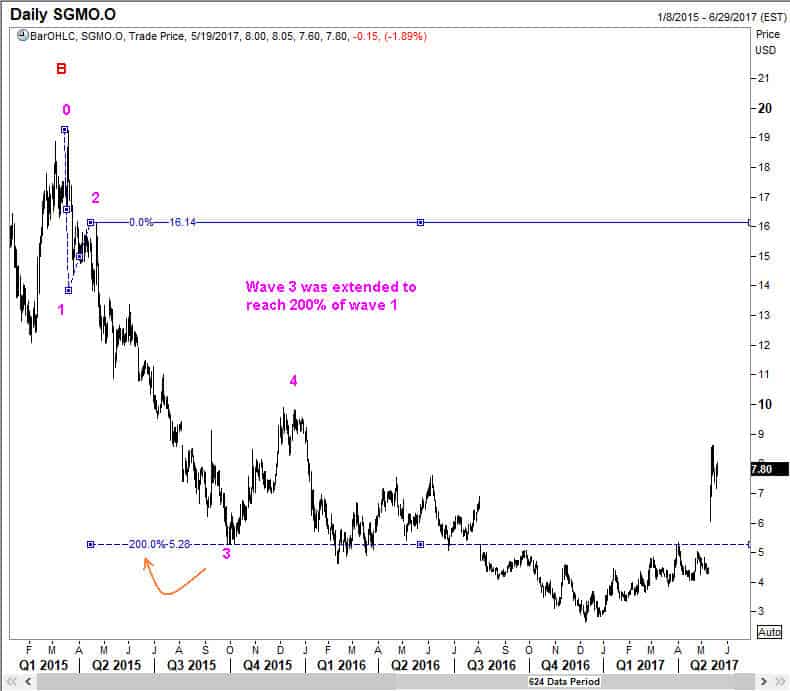
A detailed analysis of Wave C down is presented next. You can see the harmony within the sub waves. Remember, all C waves will be made up of 5 sub waves, and they will usually render themselves to the same sort of analysis as an impulse wave.


The third wave within the C wave was 200% of the first wave

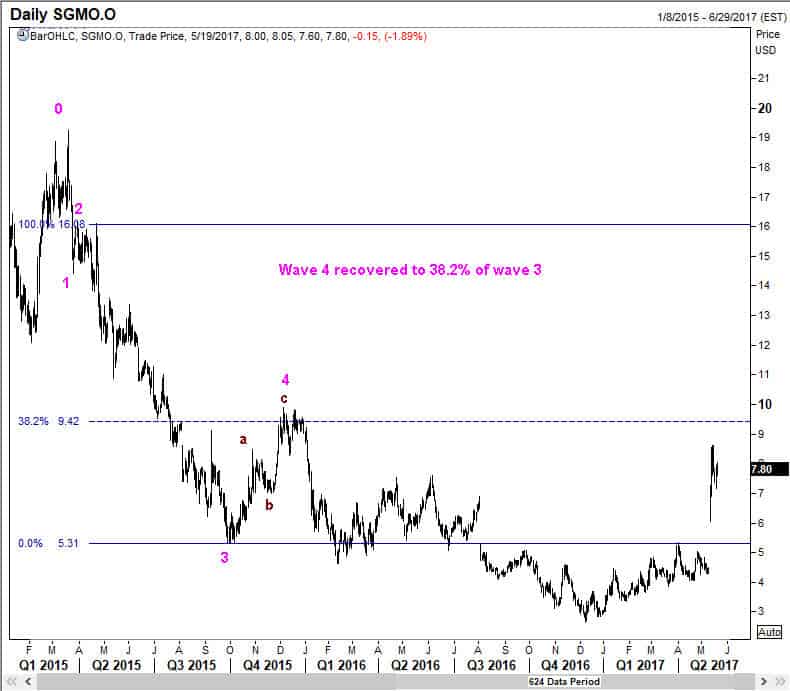
Next we will see that the fourth wave recovered exactly to the 38.2% retracement of the third wave.

Wave 4 recovered to 38.2% of wave 3

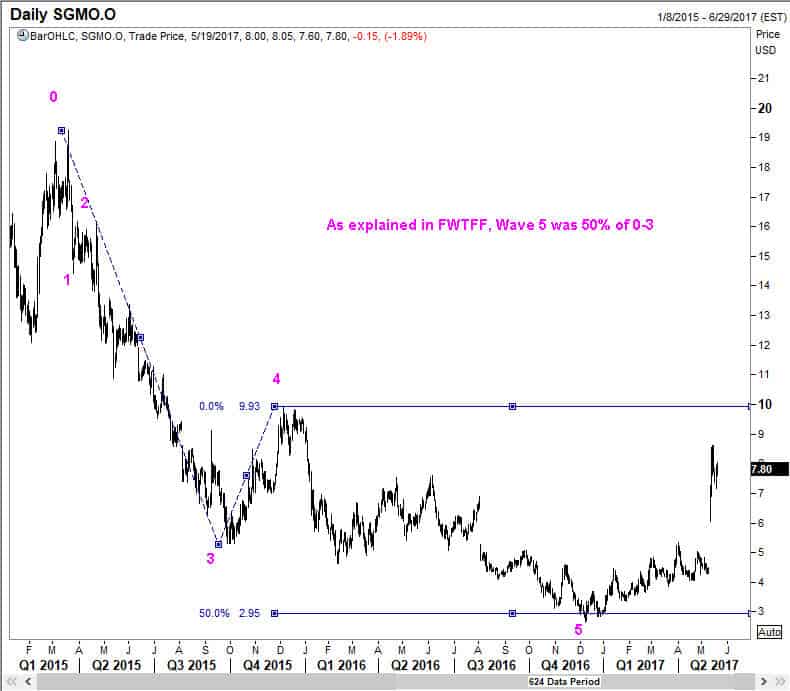
And as explained in my Elliott Wave book, “Five Waves to Financial Freedom“, we can anticipate the end of wave 5 in a 5-wave sequence by computing a Fibonacci ratio of the distance traveled from the top of wave 1 to the end of wave 3, and then subtracting that result from the end of wave 4. In the following chart of Sangamo, you will see that wave 5 of the Wave C finished exactly at 50% of the distance from the top of wave 1 to the end of wave 3.

wave 5 finished at 50% of the distance from point 0 to point 3

We will now turn to looking at the rally that started off from the $2.65 low of Dec 2016.

Your clue for wave 3 lies in its personality

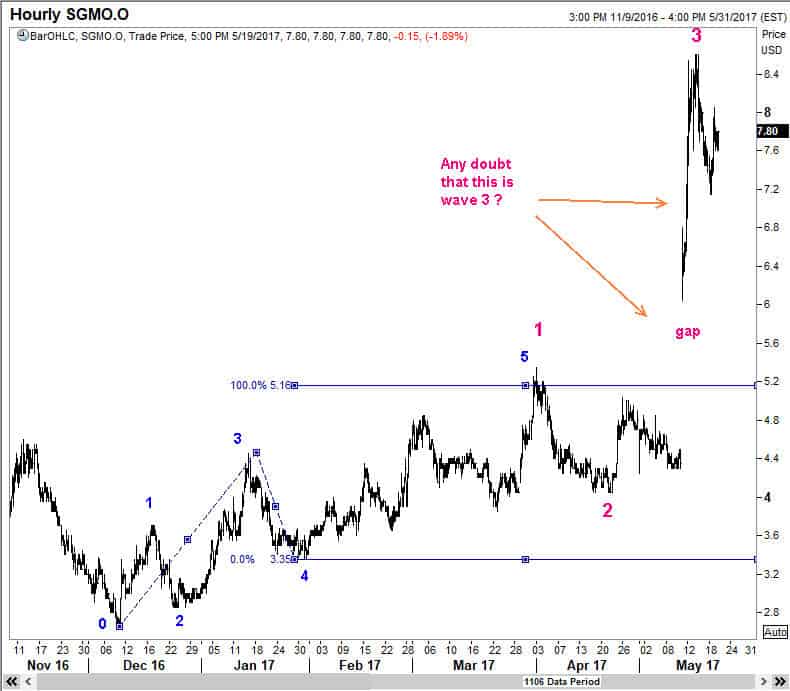
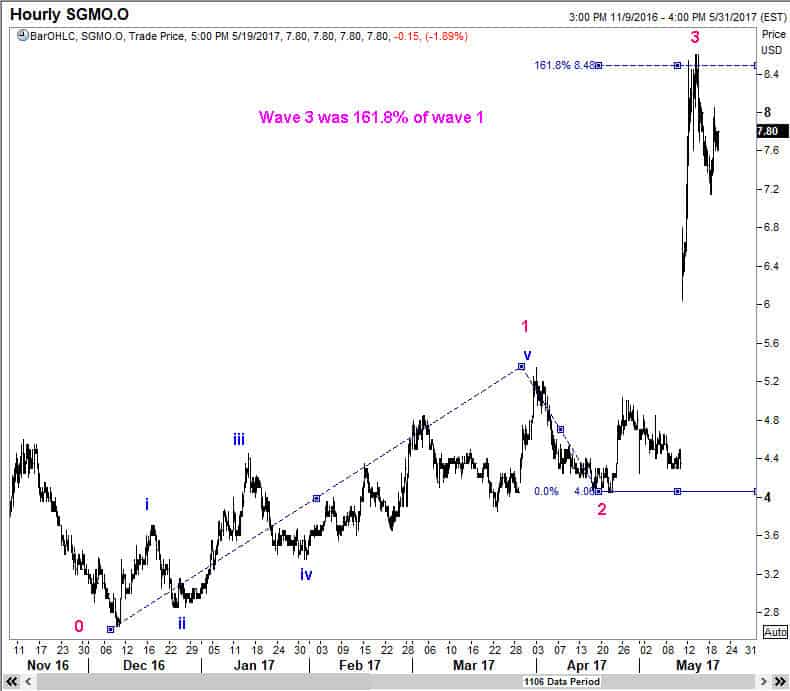
Next we see where the third wave of this new bull phase presumably ended. As you know, a third wave often travels to 161.8% projection measure of wave 1. This is what has apparently happened to Sangamo stock price.

A 3rd wave usually ends at 161.8% projection of wave 1

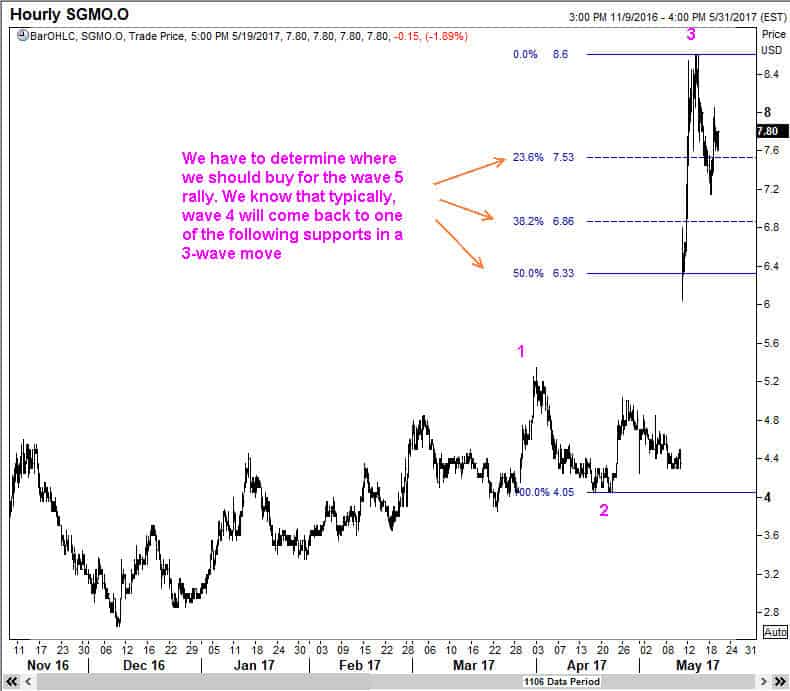
We then proceeded to determine our strategy of where to buy for the next rally, which will be wave 5. (At the back of my mind, I am always keen to be open to the possibility of an extended third wave!). I shared a few additional charts to members showing the possible ways that this wave 4 correction could develop.

Here are typical end points for a fourth wave

Here is one chart that spells out the plan of action. I hope you take note of the fact that I don’t profess to know the future. Rather I am spelling out a strategy that will keep the risks low for my members, while playing out the edge that Elliott Wave analysis offers to us traders.


Spelling out the strategy clearly is important

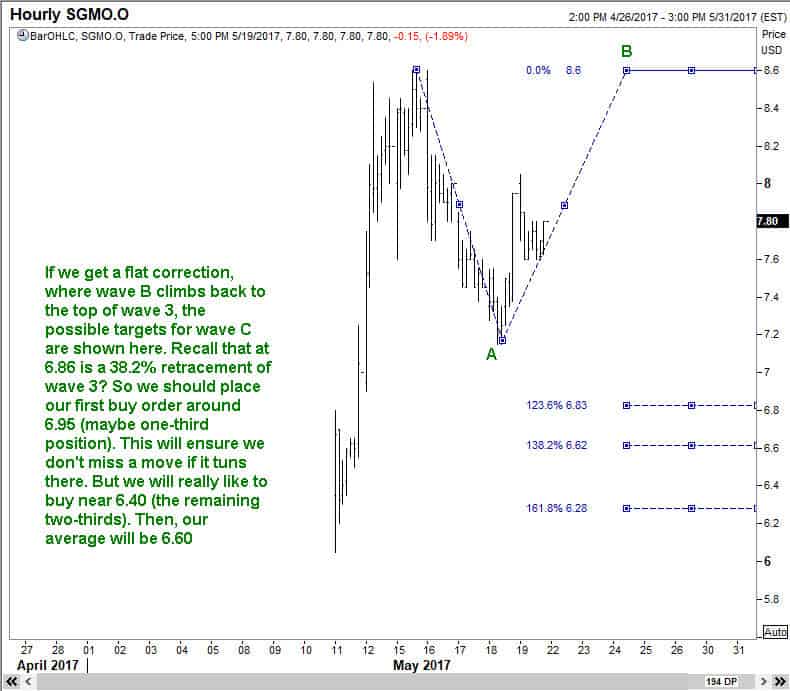
I will present one more chart that I sent my members to give you a feel of how I operate in an environment of uncertainty. Quite simply, I look at different possibilities with an open mind, and then determine what would serve us best.

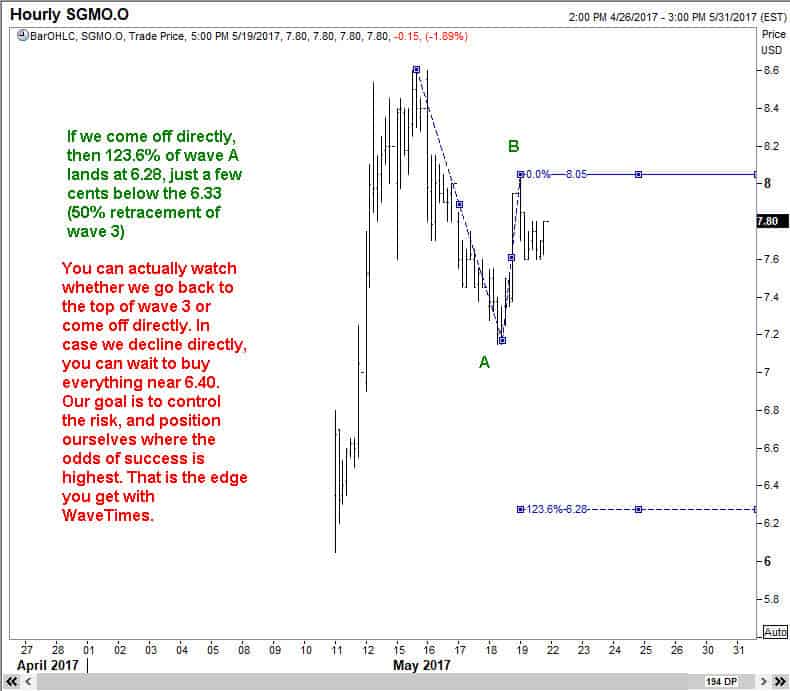
I had even suggested a stop loss at $5.25, and said we were looking to make at least 30%. But guess where it went !

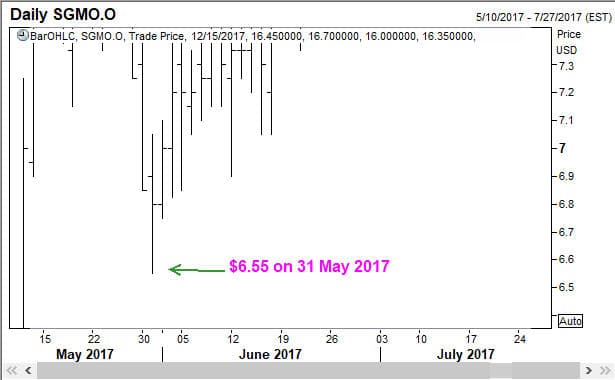
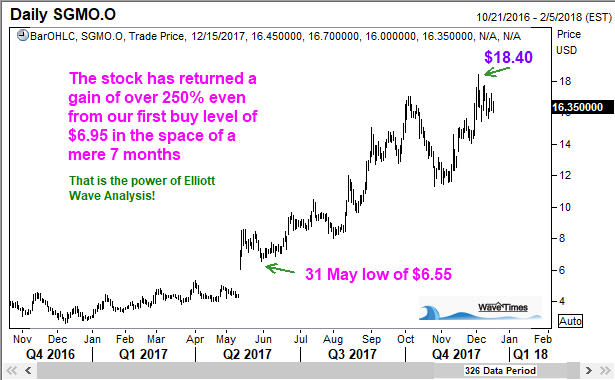
That is one part of the story. Here is the more interesting part. Here you see the power of Elliott Wave Analysis, nay, the edge that Elliott Wave analysis gives traders.

Elliott Wave Edge at work

I hope you enjoyed the above presentation. If you would like to show your appreciation of this work, please share with your friends over the social media like Facebook, Twitter etc. That way, you will also be introducing the Elliott Wave approach to your friends. And if they would like to read the much-loved Elliott Wave book, here is the link for that too: “Five Waves to Financial Freedom“

Elliott Wave Edge Sangamo Therapeutics Inc SGMO.O
Share. Facebook Twitter Pinterest LinkedIn Tumblr Telegram Email
Previous ArticleA trade that didn’t work out as desired
Next Article Elliott Waves help make over 40% in UCAL Fuel Systems in 10 days
Ramki
  • Website

Related Posts

Has Meta (Facebook) stock seen the bottom

March 21, 2022

What Is The Nearest Technical Support For Meta (NASDAQ: FB)

February 7, 2022

Hedge Funds and Elliott Waves – Netflix $NFLX

January 17, 2022
View 7 Comments

7 Comments

  1. sundar kambam on December 19, 2017 2:32 pm

    wow. Great analysis , Ramki.

    Reply
  2. Swapan Choudhury on December 23, 2017 5:13 am

    In the above hourly chart wave 4 came within wave 1, is it due to diagonal formation or something else please clarify

    Reply
    • Ramki Ramakrishnan on December 23, 2017 3:25 pm

      Swapan, Yes. It is a leading diagonal there.

      Reply
      • Prabh Singh on December 29, 2017 9:35 am

        Ramki,

        This resembles more sort of Expanding Diagonal.

        Ramki,according to Elliot guidelines and your rich expererience ,is it possible to have expanding diagonal in Wave 1 or is it like expanding diagonal are only seen in Wave 5 as part of Impulsive move.

        Reply
        • Ramki Ramakrishnan on January 2, 2018 10:55 am

          Prabh, Expanding diagonals can and do occur in both first wave position as well as in fifth wave positions.

          Reply
  3. Swapan Choudhury on December 24, 2017 11:15 am

    In the hourly chart (3rd last) I am very much interested to know the logic behind your comment “In case we decline directly,”. Because what I learned from your book FWTFF, blog & videos that ‘B’ wave retraced to some extent and did not form any lower bottom further so the price must move up to form minor ‘c’ wave up to 138.2% or 161.8% to complete small “abc” structure. If I am wrong please correct me.

    Reply
    • Ramki Ramakrishnan on December 28, 2017 5:20 pm

      Swapan, Before I enter a trade, I try to look at various possibilities. During a corrective phase, we might miss a small squiggle here and there. If everything was cut and dried for us to see clearly, then there wont be a market. Everyone will be a buyer or seller! It is the nature of the market place to appear random. Yet, we can notice an underlying rhythm. In this example, I was thinking through what will happen if it comes off directly.

      Reply

Leave A Reply Cancel Reply

Recent Posts
  • Has Meta (Facebook) stock seen the bottom
  • What Is The Nearest Technical Support For Meta (NASDAQ: FB)
  • Using Elliott Waves to Capture a Trade in S&P500
  • Hedge Funds and Elliott Waves – Netflix $NFLX
  • When Elliott Waves applauds the promoter’s signals!

WaveTimes is a Research Organization dedicated to providing original analysis, reports, reviews, and insights on developments in mutual funds, stocks, investing, foreign exchange, commodities, and bonds.

Contact WaveTimes

L-601 Mantri Espana,

Kariyammana Agrahara, Bellandur, Bangalore 560103

Follow Us

  • Facebook
  • YouTube
  • Twitter

© 2023 Wave Times. All Rights Reserved.
  • About
  • Books
  • Privacy Policy
  • Policies and Standards

Type above and press Enter to search. Press Esc to cancel.