• About
  • Elliott Waves
    • Elliott Waves Explained
    • Elliott Wave Magic Illustrated with Wave Charts
    • Elliott Wave Edge – How Elliott Wave Traders Win
    • Fibonacci Number Series and Elliott Waves
    • How to use Fibonacci Ratio Retracements
    • Elliott Wave Books
      • The Elliott Wave Book – Five Waves to Financial Freedom
      • Dividend Growth Investing Using Elliott Waves
    • Videos
  • Equities
    • Indices
      • Africa
        • Egypt
      • Australia
      • European Indices
        • AEX – Index, Amsterdam
        • DAX Index
        • Istanbul
        • Russia
        • Spain’s IBEX 35
      • Asian Indices
        • India
        • China
        • Dubai
        • Kuwait
        • Kuala Lumpur
        • Pakistan
        • Saudi
        • Taiwan
      • US Indices
        • S&P500
        • Nasdaq
        • Dow Jones
        • Dow Jones Utilities
    • Stocks
      • Asian Stocks
        • Indian Stocks Trading
        • Dubai Stocks Outlook
        • Japanese Stocks
        • Kuwait stocks
        • Saudi Stocks Outlook
      • African Stocks
        • Egyptian Stocks
      • Swiss Stocks
      • Australian Stocks
      • European Stocks
      • US Stocks outlook
      • UK Stocks
  • Commodities
    • Copper
    • Gasoline
    • Gold
    • Natural Gas
    • Oil
    • Palm Oil
    • Raw Sugar
    • Rubber
    • Soybean Oil
    • Silver
  • Forex
    • AUD
    • Bitcoin
    • CAD
    • CHF
    • Euro
    • GBP
    • INR
    • NZD
    • JPY
  • Raves
  • Consulting
    • Consulting
  • Ramki’s Watchlist
Top News

Has Meta (Facebook) stock seen the bottom

March 21, 2022

What Is The Nearest Technical Support For Meta (NASDAQ: FB)

February 7, 2022

Using Elliott Waves to Capture a Trade in S&P500

January 27, 2022
Facebook Twitter Instagram
WaveTimes Blog WaveTimes Blog
Wave times
  • About
  • Elliott Waves
    • Elliott Waves Explained
    • Elliott Wave Magic Illustrated with Wave Charts
    • Elliott Wave Edge – How Elliott Wave Traders Win
    • Fibonacci Number Series and Elliott Waves
    • How to use Fibonacci Ratio Retracements
    • Elliott Wave Books
      • The Elliott Wave Book – Five Waves to Financial Freedom
      • Dividend Growth Investing Using Elliott Waves
    • Videos
  • Equities
    • Indices
      • Africa
        • Egypt
      • Australia
      • European Indices
        • AEX – Index, Amsterdam
        • DAX Index
        • Istanbul
        • Russia
        • Spain’s IBEX 35
      • Asian Indices
        • India
        • China
        • Dubai
        • Kuwait
        • Kuala Lumpur
        • Pakistan
        • Saudi
        • Taiwan
      • US Indices
        • S&P500
        • Nasdaq
        • Dow Jones
        • Dow Jones Utilities
    • Stocks
      • Asian Stocks
        • Indian Stocks Trading
        • Dubai Stocks Outlook
        • Japanese Stocks
        • Kuwait stocks
        • Saudi Stocks Outlook
      • African Stocks
        • Egyptian Stocks
      • Swiss Stocks
      • Australian Stocks
      • European Stocks
      • US Stocks outlook
      • UK Stocks
  • Commodities
    • Copper
    • Gasoline
    • Gold
    • Natural Gas
    • Oil
    • Palm Oil
    • Raw Sugar
    • Rubber
    • Soybean Oil
    • Silver
  • Forex
    • AUD
    • Bitcoin
    • CAD
    • CHF
    • Euro
    • GBP
    • INR
    • NZD
    • JPY
  • Raves
  • Consulting
    • Consulting
  • Ramki’s Watchlist
WaveTimes Blog WaveTimes Blog
Home » Technical Analysis of Gold
Gold

Technical Analysis of Gold

RamkiBy RamkiAugust 25, 201113 Comments2 Mins Read
Facebook Twitter LinkedIn Telegram Pinterest Tumblr Reddit WhatsApp Email
Share
Facebook Twitter LinkedIn Pinterest Email

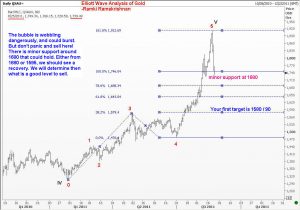
Gold came off from near the 1895/1925 window, and for a brief while it looked like the recovery from near 1815 will indeed take us back towards the highs. But the recovery couldn’t be sustained. This is why I was warning you to be very careful during that recovery. Elliott Wave analysis tells you what is a high risk area, and for that reason alone, you should study it.

What are the odds that the top is in place already? I will put it at 50% at this point in time. The bubble is wobbling dangerously, and could burst. But don’t panic and sell here! There is minor support around 1680 that could hold. Either from 1680 or 1595, we should see a recovery. We will determine then what is a good level to sell.

Remember our goal is to determine low risk trading levels. It is more important to find the right level to buy or sell, than to make a series of predictions hoping some of them will be right!
For those who wish to believe that the bubble has already burst, I present an alternate count of the final fifth wave. This count was always there, but there is no point saying we will go to point A if a certail level holds, but if that level breaks, we will go to point B. THis is what you are used to hearing on CNBC and elsewhere on the internet. What matters is to identify key levels where one can trade. 1895/1925 was a sell zone. The dip to 1815 was a buy. Our stop should have been a few dollars below 1815.
I think any recovery to 1800/1815 now will find initial resistance, because that was the level we identified as a key support earlier. So if you are still long, (or if you take a chance and buy near 1680 or 1595), you will use any recovery to 1800 area to exit.
Where should we turn short? That will depend on how the next move unfolds. I will update if I am watching the market. But you too could use my techniques to figure it out. (By the way, my book is almost ready and should be available to you very soon)

Gold
Share. Facebook Twitter Pinterest LinkedIn Tumblr Telegram Email
Previous ArticleElliott Wave Analysis of Gold
Next Article Transform your Trading!
Ramki
  • Website

Related Posts

Elliott Wave analysis benefits a short term trader in XAU/USD

June 9, 2017

Elliott Wave Analysis of Gold

April 16, 2013

Elliott Wave Analysis of Gold – September 2012

September 9, 2012
View 13 Comments

13 Comments

  1. ajay bajracharya on August 25, 2011 1:12 am

    thank you sir for your guidance so can we clearify that final (v) has ended

    Reply
  2. Stani on August 25, 2011 1:35 am

    I just want to thank you for your invaluable work for all us! Your approach to the application of Elliot waves seems to really works and that makes it unique!. Looking forward to see your book!

    Reply
  3. Muthu Nagarajan on August 25, 2011 1:54 am

    Sir, Apart from the views shared here,I am very much interested in the piece of advice that you throw here based on your experience. Although , am not commenting on every post, I do read them fully.

    One major thing which I learnt here is that you don’t stick to your counts and wait for the market to respect that count. Instead you are as fluid as the market and modify your counts as new patterns emerge. Also, you are very clear in pointing out that the goal is to identify low risk trading opportunities & making money from good trades rather than getting satisfied with a good count & forecast, the area where many Elliotticians fail.

    Reply
  4. RKG on August 25, 2011 3:00 am

    Brilliant Call on Gold. It required golden balls to call a short term top at 19xx.

    Reply
  5. Rohit on August 25, 2011 3:04 am

    Isnt there lots of similarity that among commodities crude was the last to top in Jul 2008 and this time its gold in aug 2011. Also golds top in 08 and now coincides with a 5 wave decline in the dow Omenous?

    Reply
  6. Alexander on August 25, 2011 3:04 am

    Hello Ramki

    How can I buy your book in Russia?

    Reply
    • Ramki on August 25, 2011 9:48 am

      Hi Alex, you will be able to buy it from Amazon.com in the next few days. Will alert everyone via the blog.

      Reply
  7. Yash on August 25, 2011 11:58 am

    Sir,
    Hats off to you for a absolutely tremendous piece of work in Elliott.
    “THE BUBBLE HAS BURST” – thats a true statement and its as a situation called SELL ON EVERY RISE. Looking over the chart and patterns it might go on for H&S pattern for further fall, But as per Elliott counts in concerned wave 5 is never bigger than wave 3. So, this point is striking in my mind, kindly explain regarding this.
    Thanks & Regards

    Reply
    • Ramki on August 25, 2011 11:17 pm

      Hi Yash, I would recommend that you read my post very carefully. I am giving it a 50% chance that the top is in place. Regarding fifth wave, the detailed explanation is in my book. Best wishes.

      Reply
  8. Vishal G Ruparel on August 26, 2011 9:26 pm

    Ramki ordered your book through amazon and read it non stop from start to finish,practicality of approach and simplicity is what impressed me about it,low focus on absolute theory and jargons was a plus point,keep the good work going,I just have one request can you please update your count on nifty?

    Reply
    • Ramki on August 27, 2011 1:28 am

      Vishal,
      Thank you! As far as I know, you are the FIRST person to have purchased the book because I have not informed anyone other than my children that it is available for sale. I am glad you like it. Would you mind posting an honest review on Amazon, add some Tags (click T twice) and tell all your friends on Facebook and Twitter? That will be my request to ALL my freinds who purchase the book. Importantly, please mention how the book compares with other books you have read, in content, price and usefulness. Thanks again

      Reply
  9. Sirajudeen on August 27, 2011 3:32 am

    Ramki,

    I’ll buy the book shortly. Is a Kindle version available. Anyway, I’ll check with Amazon. Thanks.

    Reply
  10. Jeetu on August 28, 2011 9:24 pm

    Sir,
    You are the best among those who predict gold silver on the basis of Elliott.
    Till now i was following the analysis on ecpulse.com .But u r much more accurate as i m following you from last one month.
    Now where does you see the gold in next 15 days….
    in hope of your reply…
    thanks and regards to you

    Reply

Leave A Reply Cancel Reply

Recent Posts
  • Has Meta (Facebook) stock seen the bottom
  • What Is The Nearest Technical Support For Meta (NASDAQ: FB)
  • Using Elliott Waves to Capture a Trade in S&P500
  • Hedge Funds and Elliott Waves – Netflix $NFLX
  • When Elliott Waves applauds the promoter’s signals!

WaveTimes is a Research Organization dedicated to providing original analysis, reports, reviews, and insights on developments in mutual funds, stocks, investing, foreign exchange, commodities, and bonds.

Contact WaveTimes

L-601 Mantri Espana,

Kariyammana Agrahara, Bellandur, Bangalore 560103

Follow Us

  • Facebook
  • YouTube
  • Twitter

© 2023 Wave Times. All Rights Reserved.
  • About
  • Books
  • Privacy Policy
  • Policies and Standards

Type above and press Enter to search. Press Esc to cancel.