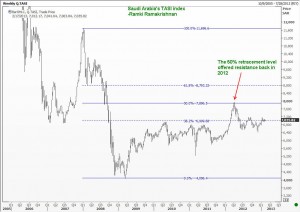
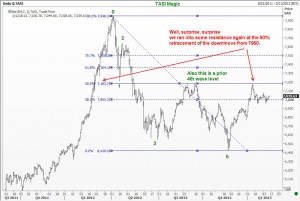
Hello Everyone. There have been several requests from traders in the Middle East for an update on the Saudi Stock Index. You should take a look even if you have no interest in this market! Let me share with you some charts today just to show how you could have identified key levels by using some of the techniques you read about in my book Five Waves To Financial Freedom” The first chart here shows how you could spotted an important turn level by identifying a 50% retracement of a prior big down move.
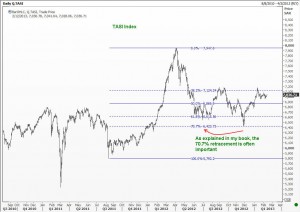
Afterwards, from around 7950, the TASI index came off to a key support at the 70.7% level as shown here.
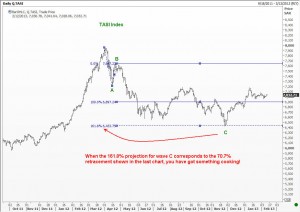
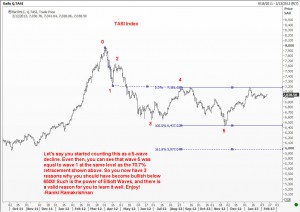
Was there any way you could have gained confidence that this support at the 70.7% level is likely to produce a bounce? Sure. Take a look at the next two charts.
More recently, we have run into some selling just below 7200. Wonder why?
Well, this blog intends to TEACH you how to use Elliott Waves. And it is all FREE. Go ahead and explore the hundreds of examples. Of course, you could also get hold of my book, if you like.

