• About
  • Elliott Waves
    • Elliott Waves Explained
    • Elliott Wave Magic Illustrated with Wave Charts
    • Elliott Wave Edge – How Elliott Wave Traders Win
    • Fibonacci Number Series and Elliott Waves
    • How to use Fibonacci Ratio Retracements
    • Elliott Wave Books
      • The Elliott Wave Book – Five Waves to Financial Freedom
      • Dividend Growth Investing Using Elliott Waves
    • Videos
  • Equities
    • Indices
      • Africa
        • Egypt
      • Australia
      • European Indices
        • AEX – Index, Amsterdam
        • DAX Index
        • Istanbul
        • Russia
        • Spain’s IBEX 35
      • Asian Indices
        • India
        • China
        • Dubai
        • Kuwait
        • Kuala Lumpur
        • Pakistan
        • Saudi
        • Taiwan
      • US Indices
        • S&P500
        • Nasdaq
        • Dow Jones
        • Dow Jones Utilities
    • Stocks
      • Asian Stocks
        • Indian Stocks Trading
        • Dubai Stocks Outlook
        • Japanese Stocks
        • Kuwait stocks
        • Saudi Stocks Outlook
      • African Stocks
        • Egyptian Stocks
      • Swiss Stocks
      • Australian Stocks
      • European Stocks
      • US Stocks outlook
      • UK Stocks
  • Commodities
    • Copper
    • Gasoline
    • Gold
    • Natural Gas
    • Oil
    • Palm Oil
    • Raw Sugar
    • Rubber
    • Soybean Oil
    • Silver
  • Forex
    • AUD
    • Bitcoin
    • CAD
    • CHF
    • Euro
    • GBP
    • INR
    • NZD
    • JPY
  • Raves
  • Consulting
    • Consulting
  • Ramki’s Watchlist
Top News

Has Meta (Facebook) stock seen the bottom

March 21, 2022

What Is The Nearest Technical Support For Meta (NASDAQ: FB)

February 7, 2022

Using Elliott Waves to Capture a Trade in S&P500

January 27, 2022
Facebook Twitter Instagram
WaveTimes Blog WaveTimes Blog
Wave times
  • About
  • Elliott Waves
    • Elliott Waves Explained
    • Elliott Wave Magic Illustrated with Wave Charts
    • Elliott Wave Edge – How Elliott Wave Traders Win
    • Fibonacci Number Series and Elliott Waves
    • How to use Fibonacci Ratio Retracements
    • Elliott Wave Books
      • The Elliott Wave Book – Five Waves to Financial Freedom
      • Dividend Growth Investing Using Elliott Waves
    • Videos
  • Equities
    • Indices
      • Africa
        • Egypt
      • Australia
      • European Indices
        • AEX – Index, Amsterdam
        • DAX Index
        • Istanbul
        • Russia
        • Spain’s IBEX 35
      • Asian Indices
        • India
        • China
        • Dubai
        • Kuwait
        • Kuala Lumpur
        • Pakistan
        • Saudi
        • Taiwan
      • US Indices
        • S&P500
        • Nasdaq
        • Dow Jones
        • Dow Jones Utilities
    • Stocks
      • Asian Stocks
        • Indian Stocks Trading
        • Dubai Stocks Outlook
        • Japanese Stocks
        • Kuwait stocks
        • Saudi Stocks Outlook
      • African Stocks
        • Egyptian Stocks
      • Swiss Stocks
      • Australian Stocks
      • European Stocks
      • US Stocks outlook
      • UK Stocks
  • Commodities
    • Copper
    • Gasoline
    • Gold
    • Natural Gas
    • Oil
    • Palm Oil
    • Raw Sugar
    • Rubber
    • Soybean Oil
    • Silver
  • Forex
    • AUD
    • Bitcoin
    • CAD
    • CHF
    • Euro
    • GBP
    • INR
    • NZD
    • JPY
  • Raves
  • Consulting
    • Consulting
  • Ramki’s Watchlist
WaveTimes Blog WaveTimes Blog
Home » Stay alert to profit
Uncategorized

Stay alert to profit

RamkiBy RamkiMay 2, 20134 Comments2 Mins Read
Facebook Twitter LinkedIn Telegram Pinterest Tumblr Reddit WhatsApp Email
Share
Facebook Twitter LinkedIn Pinterest Email

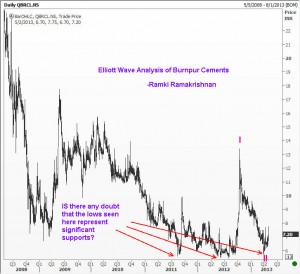
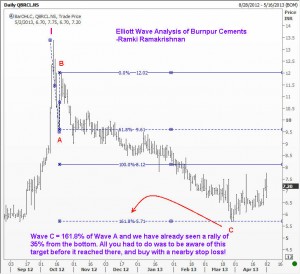
The stock market provides ample opportunities to make money. All you need to do is to stay alert, and have a watch list of stocks that you wish to be involved in. Typically, these stocks should be well traded, i.e. there should be wide participation in order for Elliott Waves to work. In my Premium Service, we only look at well traded stocks. However, the technique works well in most traded instruments. In today’s example, I will show you two charts of Burnpur Cements. I really dont know if this is a well traded stock, but when I was scrolling down the Indian Stocks alphabetically, and managed to reach “B”, this stock looked interesting. So I did some quick analysis and thought of sharing with you. You can see that I haven’t done the extensive analysis that usually goes in to my recommendations. This example is only to show you what is possible if you remain alert, meaning you should not quickly run to the market to buy this stock without doing a full analysis. Elliott Waves works wonderfully well in the stock markets too. However, don’t be fooled into thinking that all you need to know is how to compute a few Fibonacci ratios and extensions. Elliott Waves is more than that. I normally use Fibonacci relationships to confirm my wave count and to compute targets (not the other way around!). With best wishes

Share. Facebook Twitter Pinterest LinkedIn Tumblr Telegram Email
Previous ArticleTrading GBPUSD in the short term
Next Article Trading Apple using Elliott Waves
Ramki
  • Website

Related Posts

Merry Christmas and Happy New Year!

December 25, 2021

How to trade using Elliott Wave Analysis – Yes Bank

October 1, 2019

A live example of my trade in Everest Industries

October 31, 2017
View 4 Comments

4 Comments

  1. Pankaj Shah on May 2, 2013 3:13 pm

    Dear Ramki Sir,

    waiting eagerly for your update on bse sensex. after correcting from 20204 to 18144 today we have seen 80% retracement of fall at 19792.it is over bought market. RBI to announce policy tomorrow. on last 2 occasions of rbi policy announcements we have seen good corrections.

    will we do it again from tomorrow?

    nifty has retraced more than 80 % of last fall. what does it indicate ? new high after some corrections?

    Pankaj Shah

    Reply
    • Ramki Ramakrishnan on May 3, 2013 10:23 am

      Pankaj, please read my response to Gaurav under Elliott Wave Analysis of India’s Sensex – October 2012. Also, you should post questions under the right topic! Best wishes

      Reply
  2. Ankur Aditya on May 7, 2013 12:28 am

    Dear Sir,
    In converging diagonal triangle, is it manadatory that 3rd wave shud be lesser than 1st wave and 5th wave shud be lesser than 1st and 3rd wave.
    Or, if wave 3 travels around 123.6% of wave 1 and price pattern are developed in converging triangle then can we take this formation in consideration?
    Pls note – wave 1 & wave 3 madeup of 5 sub waves and 5th wave are in progression and also moving in 5 sub waves.
    Pls guide……

    Reply
    • Ramki Ramakrishnan on May 7, 2013 8:53 pm

      Ankur, by definition, the third wave within a converging diagonal will be smaller than wave 1. Perhaps your chart will soon evolve into some other formation.

      Reply

Leave A Reply Cancel Reply

Recent Posts
  • Has Meta (Facebook) stock seen the bottom
  • What Is The Nearest Technical Support For Meta (NASDAQ: FB)
  • Using Elliott Waves to Capture a Trade in S&P500
  • Hedge Funds and Elliott Waves – Netflix $NFLX
  • When Elliott Waves applauds the promoter’s signals!

WaveTimes is a Research Organization dedicated to providing original analysis, reports, reviews, and insights on developments in mutual funds, stocks, investing, foreign exchange, commodities, and bonds.

Contact WaveTimes

L-601 Mantri Espana,

Kariyammana Agrahara, Bellandur, Bangalore 560103

Follow Us

  • Facebook
  • YouTube
  • Twitter

© 2023 Wave Times. All Rights Reserved.
  • About
  • Books
  • Privacy Policy
  • Policies and Standards

Type above and press Enter to search. Press Esc to cancel.