• About
  • Elliott Waves
    • Elliott Waves Explained
    • Elliott Wave Magic Illustrated with Wave Charts
    • Elliott Wave Edge – How Elliott Wave Traders Win
    • Fibonacci Number Series and Elliott Waves
    • How to use Fibonacci Ratio Retracements
    • Elliott Wave Books
      • The Elliott Wave Book – Five Waves to Financial Freedom
      • Dividend Growth Investing Using Elliott Waves
    • Videos
  • Equities
    • Indices
      • Africa
        • Egypt
      • Australia
      • European Indices
        • AEX – Index, Amsterdam
        • DAX Index
        • Istanbul
        • Russia
        • Spain’s IBEX 35
      • Asian Indices
        • India
        • China
        • Dubai
        • Kuwait
        • Kuala Lumpur
        • Pakistan
        • Saudi
        • Taiwan
      • US Indices
        • S&P500
        • Nasdaq
        • Dow Jones
        • Dow Jones Utilities
    • Stocks
      • Asian Stocks
        • Indian Stocks Trading
        • Dubai Stocks Outlook
        • Japanese Stocks
        • Kuwait stocks
        • Saudi Stocks Outlook
      • African Stocks
        • Egyptian Stocks
      • Swiss Stocks
      • Australian Stocks
      • European Stocks
      • US Stocks outlook
      • UK Stocks
  • Commodities
    • Copper
    • Gasoline
    • Gold
    • Natural Gas
    • Oil
    • Palm Oil
    • Raw Sugar
    • Rubber
    • Soybean Oil
    • Silver
  • Forex
    • AUD
    • Bitcoin
    • CAD
    • CHF
    • Euro
    • GBP
    • INR
    • NZD
    • JPY
  • Raves
  • Consulting
    • Consulting
  • Ramki’s Watchlist
Top News

Has Meta (Facebook) stock seen the bottom

March 21, 2022

What Is The Nearest Technical Support For Meta (NASDAQ: FB)

February 7, 2022

Using Elliott Waves to Capture a Trade in S&P500

January 27, 2022
Facebook Twitter Instagram
WaveTimes Blog WaveTimes Blog
Wave times
  • About
  • Elliott Waves
    • Elliott Waves Explained
    • Elliott Wave Magic Illustrated with Wave Charts
    • Elliott Wave Edge – How Elliott Wave Traders Win
    • Fibonacci Number Series and Elliott Waves
    • How to use Fibonacci Ratio Retracements
    • Elliott Wave Books
      • The Elliott Wave Book – Five Waves to Financial Freedom
      • Dividend Growth Investing Using Elliott Waves
    • Videos
  • Equities
    • Indices
      • Africa
        • Egypt
      • Australia
      • European Indices
        • AEX – Index, Amsterdam
        • DAX Index
        • Istanbul
        • Russia
        • Spain’s IBEX 35
      • Asian Indices
        • India
        • China
        • Dubai
        • Kuwait
        • Kuala Lumpur
        • Pakistan
        • Saudi
        • Taiwan
      • US Indices
        • S&P500
        • Nasdaq
        • Dow Jones
        • Dow Jones Utilities
    • Stocks
      • Asian Stocks
        • Indian Stocks Trading
        • Dubai Stocks Outlook
        • Japanese Stocks
        • Kuwait stocks
        • Saudi Stocks Outlook
      • African Stocks
        • Egyptian Stocks
      • Swiss Stocks
      • Australian Stocks
      • European Stocks
      • US Stocks outlook
      • UK Stocks
  • Commodities
    • Copper
    • Gasoline
    • Gold
    • Natural Gas
    • Oil
    • Palm Oil
    • Raw Sugar
    • Rubber
    • Soybean Oil
    • Silver
  • Forex
    • AUD
    • Bitcoin
    • CAD
    • CHF
    • Euro
    • GBP
    • INR
    • NZD
    • JPY
  • Raves
  • Consulting
    • Consulting
  • Ramki’s Watchlist
WaveTimes Blog WaveTimes Blog
Home » SSE Composite Index: Elliott Wave Analysis
China

SSE Composite Index: Elliott Wave Analysis

RamkiBy RamkiJanuary 5, 201210 Comments2 Mins Read
Facebook Twitter LinkedIn Telegram Pinterest Tumblr Reddit WhatsApp Email
Share
Facebook Twitter LinkedIn Pinterest Email

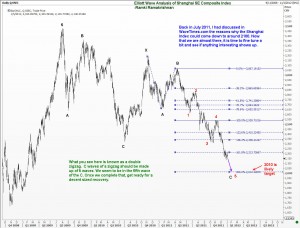
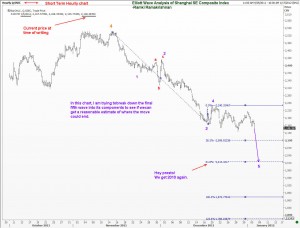
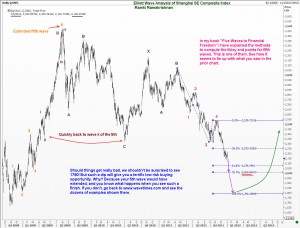
SSE Composite IndexSSE Composite IndexIn my Elliott Wave analysis of the Shanghai SE Composite Index posted on 18 July 2011, I had warned investors of the likelihood of testing the 2100 levels. The chart posted on that day had a wave count that is different from what you see today. But if you have been a regular reader of this blog, you know that my approach to the market is one where what matters is the result, and not the labels. We should trade our theory and so long as the rules and guidelines given by Ralph Elliott are not violated, we shouldn’t worry too much.

Now that we have almost reached the said target, it is natural that investors would wonder if it was time to start buying. (And those who have been short to start thinking about taking profits!) Given the fairly aggressive selling we have seen from November of last year, I think the SSE Composite index will go down to at least the 2010 levels. Down there is a place to start taking profits on short positions. But a really attractive buy level would show up lower still, around 1800. If the index reaches that low, we would have seen an extended fifth wave, and such a formation makes my mouth water, because any reversal after completing an extended fifth wave will offer handsome rewards. Take a look at the attached charts and let me know what you think.

chinese stocks
Share. Facebook Twitter Pinterest LinkedIn Tumblr Telegram Email
Previous ArticleAltria Group ready to lose 20% in value
Next Article Red Hat, Inc (NYSE: RHT) Elliott Wave Analysis
Ramki
  • Website

Related Posts

Shanghai Stock Index Update

March 28, 2012

Elliott Wave Analysis of Shanghai Stock Index

March 18, 2012

Elliott Wave Analysis of Shanghai SE Composite Index Nov 2011

October 30, 2011
View 10 Comments

10 Comments

  1. Dave on January 5, 2012 7:23 am

    Looks like a 3-3-5 pattern actually, and we are in 5 of the final 5 waves down… figuring out 5th waves is really tough, so best to start scaling in long

    Reply
  2. Joe on January 5, 2012 9:51 am

    Hi Ramki

    Did you mean go down to the 2008 level bcos we are already below 2010 levels. Am I getting this wrong.

    Thanks
    J

    Reply
    • Ramki on January 6, 2012 12:10 am

      Hi Joe, the 2010 is not the year 2010, but the level of the index. There will be some support there, but at this point in time, I feel we could break that. Let us see.

      Reply
  3. Yan on January 5, 2012 1:41 pm

    Sir, very impressed with your wave count on Shanghai index.

    this was the weekly wave count I did on the 28th of Dec 2011.

    http://screencast.com/t/9gvRL4Nwh

    where 1782 was a very significant S/R in the past. because I labelled it 1 and 2 (in yellow) where you labelled it A and B. think you are right , because wave A is a thee wave move.

    whether the current 5th wave on the daily chart will extend or not? we need to zoom in and look at the internal wave structure. this is todays hourly chart: http://screencast.com/t/jCIubjbeJ

    where we have 1234 (in yellow color) where the 3rd wave is almost 1.382 of the wave 1. and in the 5th wave, we have sub divided red color 12 and 34, but where the 3 and 4 could well be wave i and wave ii in the smaller degree. so we still not sure whether the 5th will extend. I guess if the incoming drop looks sharp and deep (personality of the 3rd wave) then we can say it is 1212 wave count in the 5th. but if the final drop slow and curve, and we get MACD positive divergence, then 2060 will probably be the bottom.

    would you agree with my interpretation Sir?

    thanks,

    Yan

    Reply
  4. abhinavjain on January 6, 2012 8:21 am

    Dear sir
    read your book, excellent one among all elliot wave books…
    one question can extended wave 3 travel upto 500% of wave one……
    Also need your view on NIFTY. Its long time to have your update on it…..
    I think we are in ending diagonal in nifty and right now wave “d” progressing and wave “e” should complete by end of january… i.e. nifty bottoming this january itself…
    your comment pls……………

    Reply
    • Ramki on January 7, 2012 12:21 am

      Hi Abhi, Yes, there is no preset limit where extensions should stop. Will post on NIfty soon

      Reply
  5. Yan on January 6, 2012 6:14 pm

    Sir, I think todays price action probably gave us a clearer signal.

    this is hourly chart on Shanghai index. http://screencast.com/t/IoWBaEFg4qo

    we have a extended 3rd wave, within the 3rd wave, the red color wave iii=1.618 of wave i and wave iv =0.382 of wave iii. the final wave v is a ‘expending wedge’, wave v=50% of from beginning of red wave i to the end of red wave iii. wow.

    so if the white color wave 4) will end at 38.2% of wave 3) then this bounce should terminate at 2244. and the white wave 3)=1.382 of wave 1) so the 5) th wave should extend, if it does, and project it with 100% of 0–3 from 2244, we get 1824.

    Reply
  6. Rajeev on January 6, 2012 8:03 pm

    Does anyone know ETFs which track SSE?

    Ramki, can you please spare some time and provide an update on Silver? I am not sure to go long or short.

    Reply
    • Ramki on January 7, 2012 12:16 am

      Hello Rajeev,
      Check out this Forbes article: http://www.forbes.com/sites/greatspeculations/2012/01/05/chinese-stocks-shanghaied-but-still-getting-cheaper/ and you might get some clues.

      Reply
  7. Yan on March 9, 2012 4:49 am

    Hello Sir.

    The Shanghai Index has rallied 300points since the 2132 low.

    any chance for an update on the future of this index please.

    Many Thanks,

    Yan

    Reply

Leave A Reply Cancel Reply

Recent Posts
  • Has Meta (Facebook) stock seen the bottom
  • What Is The Nearest Technical Support For Meta (NASDAQ: FB)
  • Using Elliott Waves to Capture a Trade in S&P500
  • Hedge Funds and Elliott Waves – Netflix $NFLX
  • When Elliott Waves applauds the promoter’s signals!

WaveTimes is a Research Organization dedicated to providing original analysis, reports, reviews, and insights on developments in mutual funds, stocks, investing, foreign exchange, commodities, and bonds.

Contact WaveTimes

L-601 Mantri Espana,

Kariyammana Agrahara, Bellandur, Bangalore 560103

Follow Us

  • Facebook
  • YouTube
  • Twitter

© 2023 Wave Times. All Rights Reserved.
  • About
  • Books
  • Privacy Policy
  • Policies and Standards

Type above and press Enter to search. Press Esc to cancel.