This is another example of a trade that I recommended to a member who chose the consulting option. As you know, WaveTimes readers and members come from every corner of the world, and have interest in a variety of markets. This lady is an active trader in the AUD/NZD cross. The following charts were sent to her yesterday, before the moves unfolded precisely as anticipated. It is important to know that sound analysis is only one half of what makes a successful trade. The ability to consider what could go wrong, and the willingness to take the plunge when the time and levels are right, as well as the fortitude to hold on to the position till one is stopped or the profit target is reached constitute the other half. Truth be told, the share of the two parts is more like 30-70, and not 50-50. So let us now take a look at the following charts and see if you can learn again from the experience.
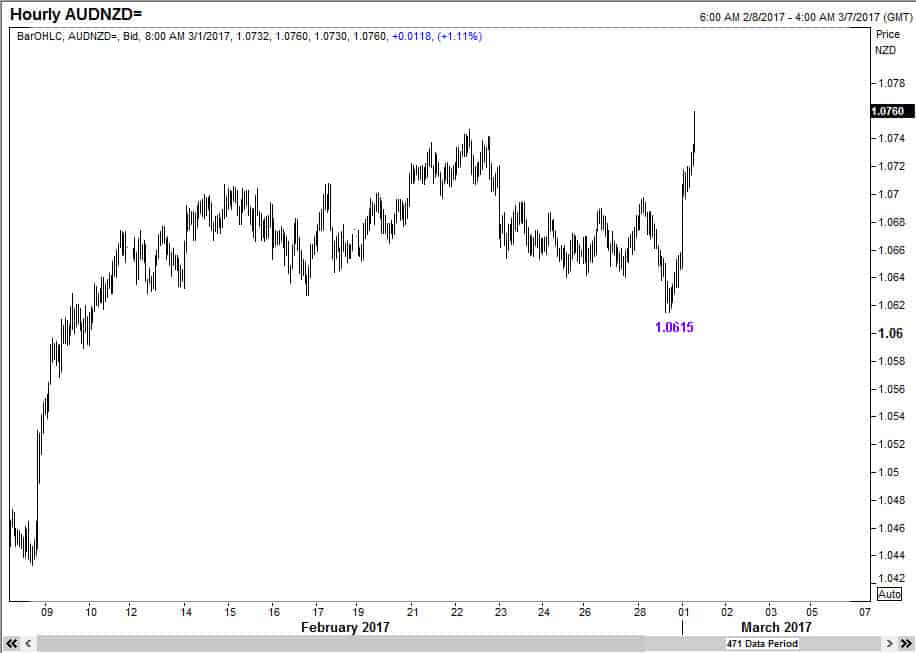
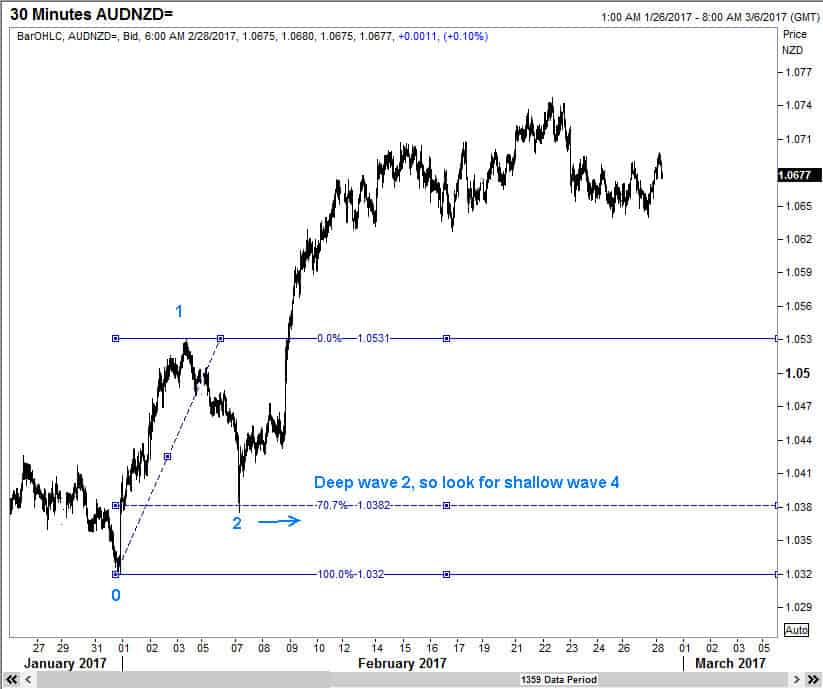
The Australian Dollar versus New Zealand Dollar is an actively traded cross across the Far East. In the first chart below, you can see that we start our count from a significant low. Wave 2 has come down to the 70.7% retracement level of wave 1. In Elliott Wave analysis, wave 2 can go all the way down to up to but no more than 100% of wave 1. These rules and associated Elliott Wave guidelines have been well explained in my Elliott Wave book Five Waves to Financial Freedom. You can get your copy from Amazon.com for under $10.
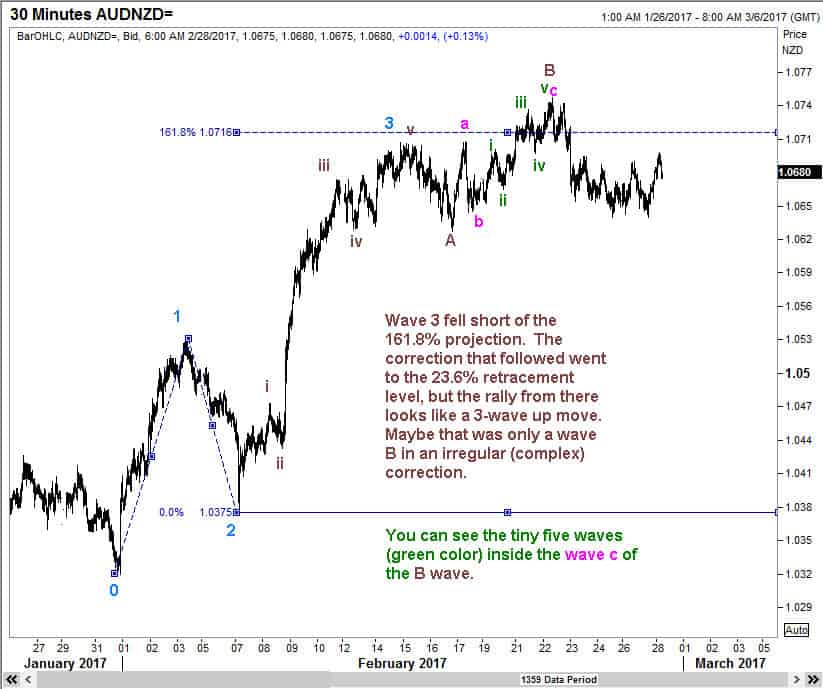
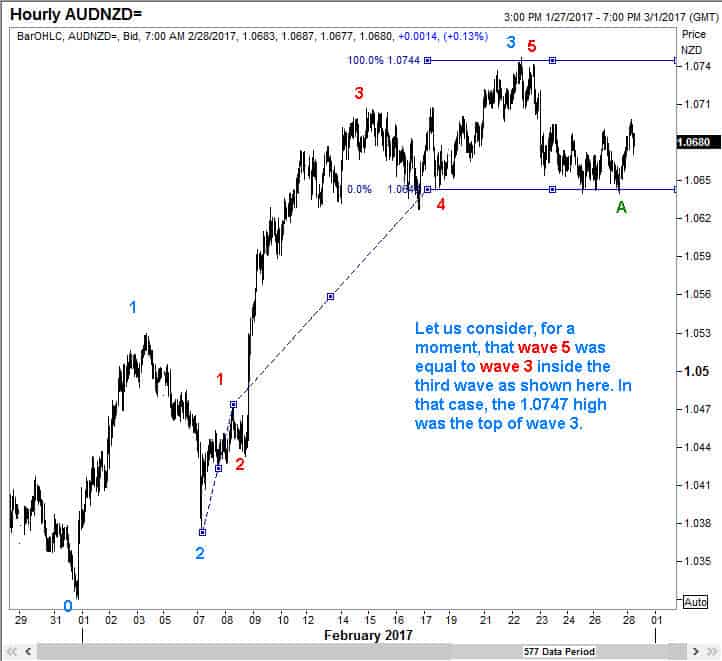
Here is a discussion of wave 3. You can see how I am making the case that the rally to a new high after the first move down from the wave 3 top is NOT the fifth wave, rather it is more likely to be an irregular B wave top of a complex correction.
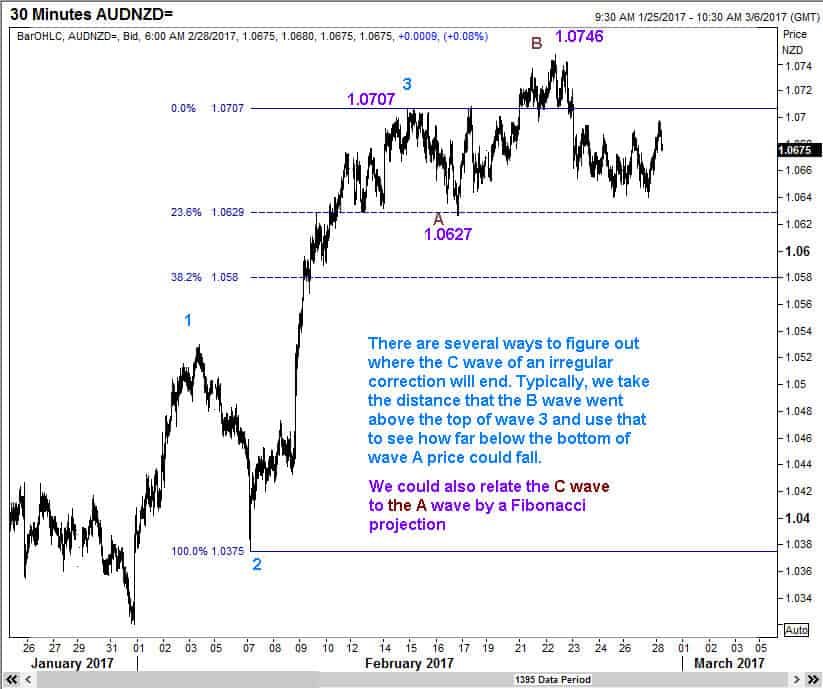
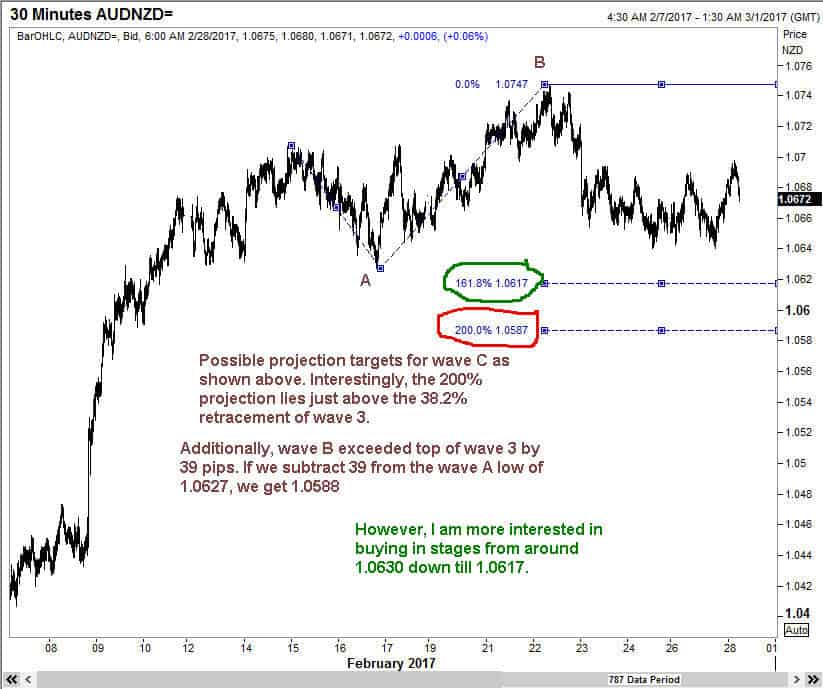
I have then discussed how to figure out the possible end points for the C wave of the irregular fourth wave.
In the next chart, the targets discussed earlier are shown clearly labeled. In my opinion, when a trader is given the reason for a particular course of action, there is a lot more credibility. Members of the premium service not only get guidance on what the waves are indicating, but also get a chance to learn in real time. You can see that my views are stated clearly in the green font on the chart below. There are other times when I tell my clients that I don’t have a clue what will happen next, and it is best for them NOT to get involved. That is also valuable advice. Far too often, traders want to be involved because they feel that they are missing out on the action. That is not how I operate. We get involved when there is a low-risk opportunity, where the rewards are significant. At other times, we are content to sit wand watch. (By the way, I am off on a 3-week holiday starting this week end. I will be traveling to many cities in Australia and New Zealand, and if possible, I’d love the chance to have coffee with some of you down there!)
Here, I am delving a bit deeper to see of we can make sense of the third wave by itself. Every bit of additional clue is valuable. After all, this is not a trivial exercise. We are speaking of real money.
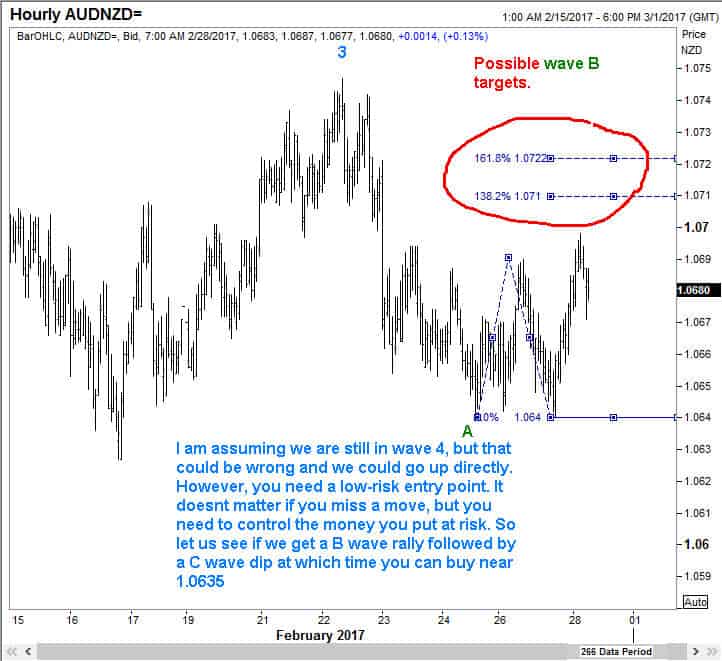
Here comes the crucial part, the weighing of different outcomes and deciding WHERE we should enter the market. You can see that I am NOT ashamed to say that I could be wrong. What is important to my members is not whether I am right or wrong, but whether we are making the right trading decision. If you go back to the home page of wavetimes.com, and read the various pages, you will see that I have been faithful to this theme everywhere.
Finally, the recommendation.
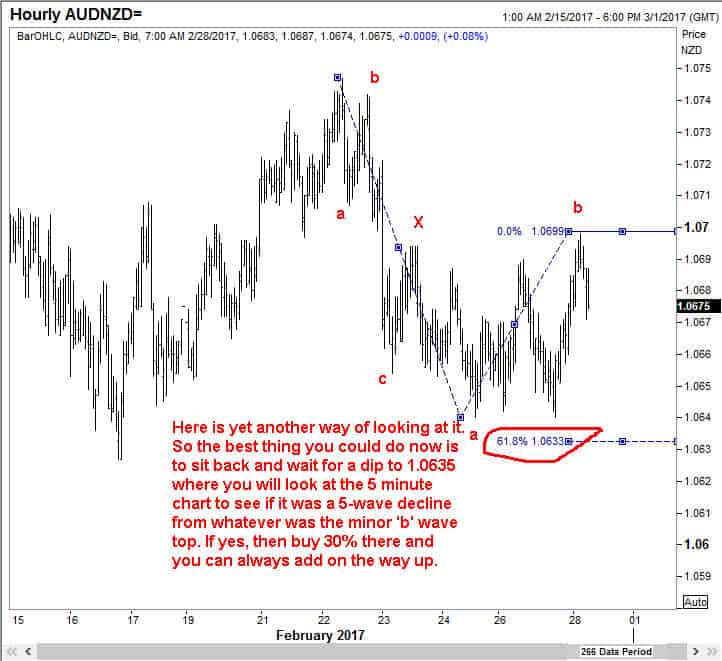
And what do you think happened?