The following Elliott Waves example shows you how a 25% move in Natco Pharma Ltd was anticipated. This is quite impressive, because it took the stock only a short time to reach that target.
The first point you should note is I am looking at a weekly chart of Natco Pharma. I had to zoom in to figure out where wave 2 low happened. With Elliott Waves, it is important to determine the kind of corrections that happened before you get involved. These kinds of inputs are not available in any Elliott Wave text books! Not sure if I mentioned it in as many words in my own book ‘Five Waves to Financial Freedom’ although I made a serious effort to share as much information as possible to make your learning easy.
Elliott Wave analysis is fun to do, and gives us a great sense of achievement when the market does what we anticipated. Unfortunately, that does not translate into money unless you also have a strategy element thrown in. We shall see.
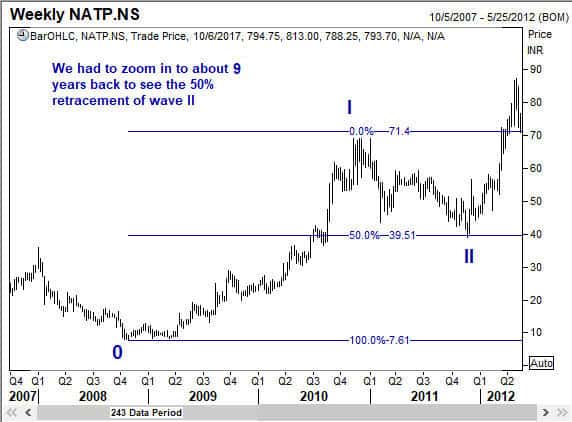
So you can see in the chart above that Wave 1 went from about 7.60 to 71.4. almost a 10-bagger, of which I had no clue because I was busy running the dealing room of a bank in a different part of the world. That is actually nothing because when I finally looked at it in early October 2017, it was trading at 793, which means it went up 100 times. (If you wish to make money, you should be in an emerging market like India, and focus on individual stocks).
Anyway, back to Elliott Wave analysis of Natco Pharma Ltd. Let me show you another chart where I posted a Wave II of a higher degree.
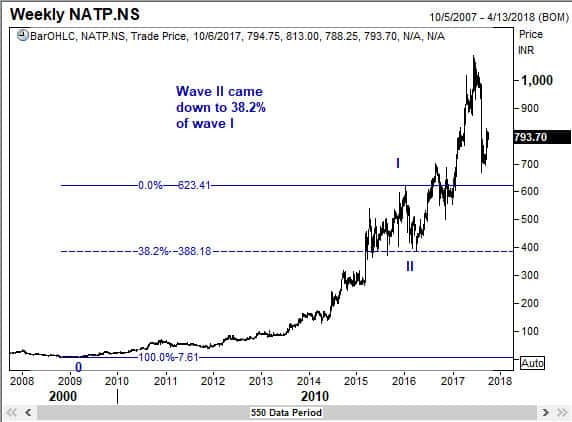
Now things are getting interesting. Wave II was shallow, so Wave IV should be deep. We shall see.
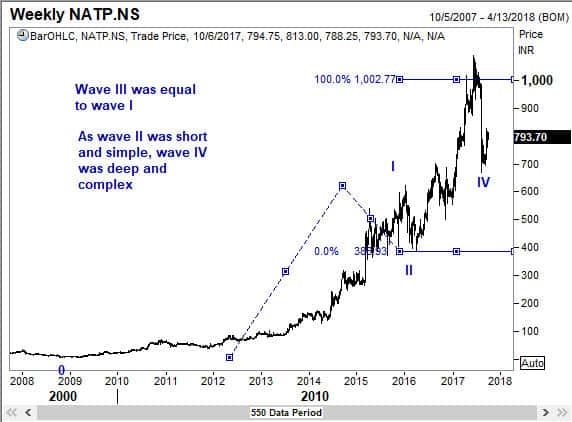
So, having decided the first four waves, I am now ready to buy the stock for is wave V move. Let us see what the possible targets are. Remember, I have explained the technique for that in FWTFF book.
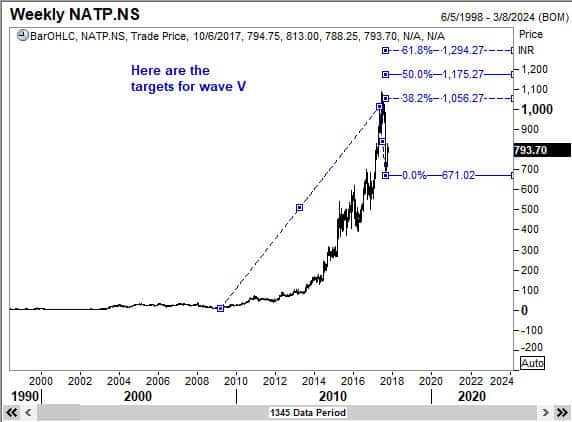
So a move to 1056 is the minimum target for wave V, and from the current level of 793.7 when I prepared this analysis, that is a 33% potential up move. Wow!
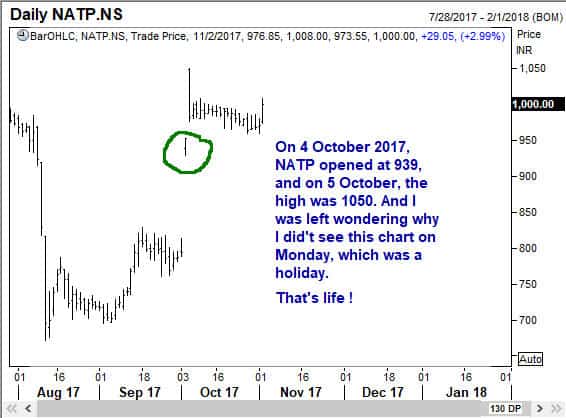
I look at several stocks on a daily basis for my clients, and sometimes, by the end of the day, I am happy to go and do something completely different. I had prepared the above chart on 3 October 2017. You can verify that by looking at the opening price for the week of 6 October, it is 794.75 as shown in these charts above. That was the opening price on 3 October 2017. And guess what happened on 4 October 2017.
So, dear readers, there is some serious money to be made in these markets. Not every pick returns 25% in 2 days, but getting to make 8% every few weeks is certainly within reach. You can ask members of WaveTimes.
Best wishes
