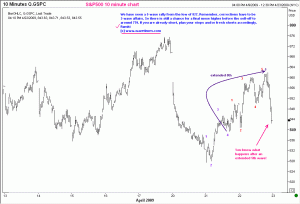
First, remember that we are not discussing a major top for S&P500. What we are focusing on now is the top around 875 because we determined that a five wave rally that had a diagonal triangle in its fifth wave position is badly in need of a correction! Having decided that we will see a decline in the broad market, we are trying to figure out the best (low-risk) entry level on the short side. We got an initial sell-off earlier on, followed by a nice recovery. However, this recovery, off the low of 827, seems to be a five-wave move in itself. This means we have to be cautious with any shorts here because there could be yet another attempt higher, which will very likely be the best opportunity for you to sell. (Of course you should always have stops in place). Take a look at the chart below,
and observe the nuances carefully. Elliott wave analysis of S&P500, or for that matter any stock, commodity or forex, is always interesting, (especially when the going in good, right!) Enjoy.
Related S&P500 links:
Was that the stock market bottom?
SNP500 revisited
S&P500 and Citi
Fifth wave extensions can make you rich!
What is a significant rally in the stock markets?
Harmony in markets: S&P500
S&P 500: Potential Ending Diagonal Triangle
Ending Diagonal Triangle in S&P500?
S&P500 Elliott Wave update
S&P 500 update: where is the top?
S&P500 continues its rally
S&P500 remains resilient
S&P500 ready to dive?
S&P500 Update: May 19, 2009
S&P500 Elliott Wave update:21 May 2009
S&P 500 breaks higher: update 2 June 2009


