Let me start with a brief introduction of PI Industries Ltd to readers who are not familiar with Indian Stocks. (Remember, this blog exists to help you understand how to use Elliott Waves better. For those who want personalized service, the exclusive club of WaveTimes is the right place to go).
PI Industries Ltd (PI) was incorporated in 1947. Today, PI is one of the leading AgroChemical companies in India.PI Industries extends their leadership stance globally and have become a ‘Partner of Choice’ among top global agrochemical giants.
Its market cap is RS 11,400 crores (or 1.7 bln USD). The stock has a P/E of Rs 32.40 at the current market price of Rs 831.40. Its book value is Rs 93.54 and its 52-week high/low is Rs 878.95/497.55.
Research done by Nitin Rao & his team at Alphaideas.in shows the following top investors added PI Industries to their portfolio during the quarter ended June 2016.
Amansa Holdings Pvt Ltd: Took a fresh stake of 1.16% of PI Industries Ltd for Rs 120.5 cr
Cartica Capital Ltd: Added 9.3% to their existing already large position to take their stake in PI Industries Ltd to 6.19% or Rs 544.82 cr
Smallcap World Fund: Took a fresh stake of 1.05% of PI Industries Ltd for Rs 109.02 cr
Besides the above large stake holders, the Govt. Pension Fund Global and Oppenheimer Intl. Small Company Fund have respectively a 1% and 1.89% exposure to PI Industries Ltd.
Considering that the three large players mentioned above have purchased a sizeable stake in PI Industries during March-June 2016, should we go and buy some shares for our portfolio now? Let us do some Elliott Wave Analysis to help us with that decision!
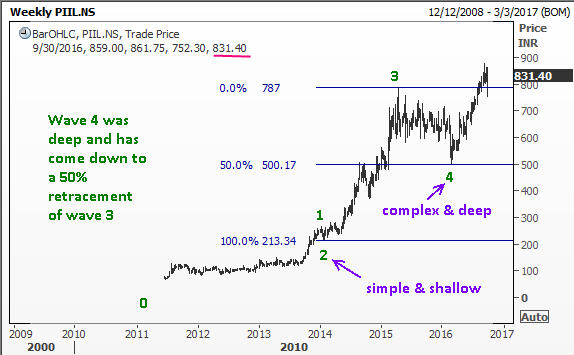
The above chart of PI Industries is a nice illustration of how corrections tend to alternate in personality. We note that wave 2 was simple, shallow and took only a short time to complete. In contrast, wave 4 was complex, deep and took quite some time to complete its retarcement to the 50% level. So, it appears that wave 5 had commenced at Rs 497.55 seen of 2 February, 2016. How high can wave 5 travel?
As explained in my book “Five Waves to Financial Freedom”, one way of anticipating the target for wave 5 is to take the distance from the starting point of wave 1 to the final point in wave 3, and them computing some fibonacci ratios of that distance, which will tell us the potential measure for wave 5.
With the data that is available to me, the low in June 2011 was 68. But you should check the correct level for a significant low immediately preceding that date and re-work the target. (In the big picture, it is not going to make any significant difference to the decision!) The peak of wave 3 came in at Rs 787.20. Thus the measure of 0-3 was 719.20 (Even if we took the absolute low was zero, the measure will be 787!)
We now compute 61.8% of 719 to get 444. If we add 444 to the wave 4 low of 497 in February 2016, we get 941. (61.8% of 787 will be 486, moving the target up by a mere Rs 42 to Rs 983).
We are currently trading at Rs 831.40. We know that once a five wave movement is over, the ensuing correction will be bigger and last longer than either of the two corrections that went before it. Wave 4 lasted about 7 months. It also measured about Rs 290. Thus, the next correction will be more than Rs 290 and will last more than 7 months. The remaining upside (if any) will range from between Rs 110 to Rs 152.( How did we get that? 941-831=110). So do we want to enter into a position that has an optimistic target of 152 (but more likely to fall short of that) versus a risk that it can move more than 290 against us and tie us down for at least 7 months once the correction starts?
Thus, no matter how influential the investor is, or how big his stake is in this company, that information is already reflected in the price. Are the fundamentals of the company going to surprise us positively (in a larger degree than indicated by the current expectations)? My approach to the market is to only take bets where the odds are clearly in our favor. Of course, tomorrow morning a fresh news could land on our screen suggesting that something dramatic and positive has happened to the company’s fortune and it could shoot to the moon. But I never wish to invest in the hope that something like that could happen!
If you would like to share the above analysis, there are some helpful social media buttons below. Go ahead, and let your friends know! -Ramki
