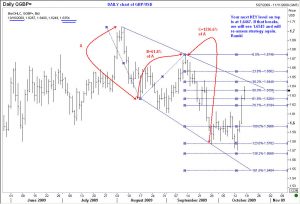
 On 5th October 2009, I posted an early warning to traders of Sterling Pound (GBP/USD)that there is something fishy about the decline from 1.6742, and we are likely to see another rally in the Pound. Trouble is, it is so damn hard to believe such calls, and when the rally eventually shows up, many of us just freeze. Some traders would have continued to pick tops, and lost lots of money. One mistake that many interbank traders continue to make, (and I am no exception to this folly !) is they fail to switch their minds from intra-day charts to daily charts when something unusual happens. My post of 5th October was a bigger-picture call and was based on the daily chart. The moves we have seen in the last two trading days fits in to such a time frame. The update of 12th October (which I called a real-time update on sterling) showed a one-minute chart and also a TIC chart. This latter post was for intraday trades, and it called for a decline in GBP to 1.5685. The actual low was 1.5705. If a trader sold at the first resistance when the Pound jumped from 1.5705, he can be excused, because one can never be sure whether the bounce was corrective or not. He/she would have been quickly stopped, as I too was! But when the move continued higher, an alert trader would have considered if the big picture was changing too. If you have been a careful reader of the GBP/USD updates posted here over the last few months, then this lesson is very valuable indeed.
The next question is how high can the bounce go? There is one ‘secret’ that many practising wave analysts tend to forget. Elliott reckoned that a correction will have two dimensions: time and space. A typical move tends to follow the fibonacci summation series. If a rally has moved up 3 days and remains bid, you can continue to look for it to last 5 days. Beyond 5 days it should last for 8 days. If you look at the daily chart, you will see that we have had FOUR “up” days. So one more day of rallying is very likely. I offer 1.6467 as a first target, and beyond that we could well see 1.6545.
One can make lots of money in these markets provided one has the appetite for risk, and one is willing to follow the rules of the game. A key rule concerns money management. It is OK to lose on a trade, but be sure that you don’t lose so much money on any one trade that you are unable to come to the table again. Good luck and bifn. Ramki

