• About
  • Elliott Waves
    • Elliott Waves Explained
    • Elliott Wave Magic Illustrated with Wave Charts
    • Elliott Wave Edge – How Elliott Wave Traders Win
    • Fibonacci Number Series and Elliott Waves
    • How to use Fibonacci Ratio Retracements
    • Elliott Wave Books
      • The Elliott Wave Book – Five Waves to Financial Freedom
      • Dividend Growth Investing Using Elliott Waves
    • Videos
  • Equities
    • Indices
      • Africa
        • Egypt
      • Australia
      • European Indices
        • AEX – Index, Amsterdam
        • DAX Index
        • Istanbul
        • Russia
        • Spain’s IBEX 35
      • Asian Indices
        • India
        • China
        • Dubai
        • Kuwait
        • Kuala Lumpur
        • Pakistan
        • Saudi
        • Taiwan
      • US Indices
        • S&P500
        • Nasdaq
        • Dow Jones
        • Dow Jones Utilities
    • Stocks
      • Asian Stocks
        • Indian Stocks Trading
        • Dubai Stocks Outlook
        • Japanese Stocks
        • Kuwait stocks
        • Saudi Stocks Outlook
      • African Stocks
        • Egyptian Stocks
      • Swiss Stocks
      • Australian Stocks
      • European Stocks
      • US Stocks outlook
      • UK Stocks
  • Commodities
    • Copper
    • Gasoline
    • Gold
    • Natural Gas
    • Oil
    • Palm Oil
    • Raw Sugar
    • Rubber
    • Soybean Oil
    • Silver
  • Forex
    • AUD
    • Bitcoin
    • CAD
    • CHF
    • Euro
    • GBP
    • INR
    • NZD
    • JPY
  • Raves
  • Consulting
    • Consulting
  • Ramki’s Watchlist
Top News

Has Meta (Facebook) stock seen the bottom

March 21, 2022

What Is The Nearest Technical Support For Meta (NASDAQ: FB)

February 7, 2022

Using Elliott Waves to Capture a Trade in S&P500

January 27, 2022
Facebook Twitter Instagram
WaveTimes Blog WaveTimes Blog
Wave times
  • About
  • Elliott Waves
    • Elliott Waves Explained
    • Elliott Wave Magic Illustrated with Wave Charts
    • Elliott Wave Edge – How Elliott Wave Traders Win
    • Fibonacci Number Series and Elliott Waves
    • How to use Fibonacci Ratio Retracements
    • Elliott Wave Books
      • The Elliott Wave Book – Five Waves to Financial Freedom
      • Dividend Growth Investing Using Elliott Waves
    • Videos
  • Equities
    • Indices
      • Africa
        • Egypt
      • Australia
      • European Indices
        • AEX – Index, Amsterdam
        • DAX Index
        • Istanbul
        • Russia
        • Spain’s IBEX 35
      • Asian Indices
        • India
        • China
        • Dubai
        • Kuwait
        • Kuala Lumpur
        • Pakistan
        • Saudi
        • Taiwan
      • US Indices
        • S&P500
        • Nasdaq
        • Dow Jones
        • Dow Jones Utilities
    • Stocks
      • Asian Stocks
        • Indian Stocks Trading
        • Dubai Stocks Outlook
        • Japanese Stocks
        • Kuwait stocks
        • Saudi Stocks Outlook
      • African Stocks
        • Egyptian Stocks
      • Swiss Stocks
      • Australian Stocks
      • European Stocks
      • US Stocks outlook
      • UK Stocks
  • Commodities
    • Copper
    • Gasoline
    • Gold
    • Natural Gas
    • Oil
    • Palm Oil
    • Raw Sugar
    • Rubber
    • Soybean Oil
    • Silver
  • Forex
    • AUD
    • Bitcoin
    • CAD
    • CHF
    • Euro
    • GBP
    • INR
    • NZD
    • JPY
  • Raves
  • Consulting
    • Consulting
  • Ramki’s Watchlist
WaveTimes Blog WaveTimes Blog
Home » Randgold Trade closed with a gain of 12%-22%
US Stocks outlook

Randgold Trade closed with a gain of 12%-22%

RamkiBy RamkiJanuary 6, 20176 Comments1 Min Read
Facebook Twitter LinkedIn Telegram Pinterest Tumblr Reddit WhatsApp Email
Share
Facebook Twitter LinkedIn Pinterest Email

I present you with some of the charts that the members of our Exclusive Club were privy to while they made over 12% without too much sweat.

I had sent an email notification to ACTIVE members, i.e. those who had at least 1 unit left in their account, on 21 November 2016:

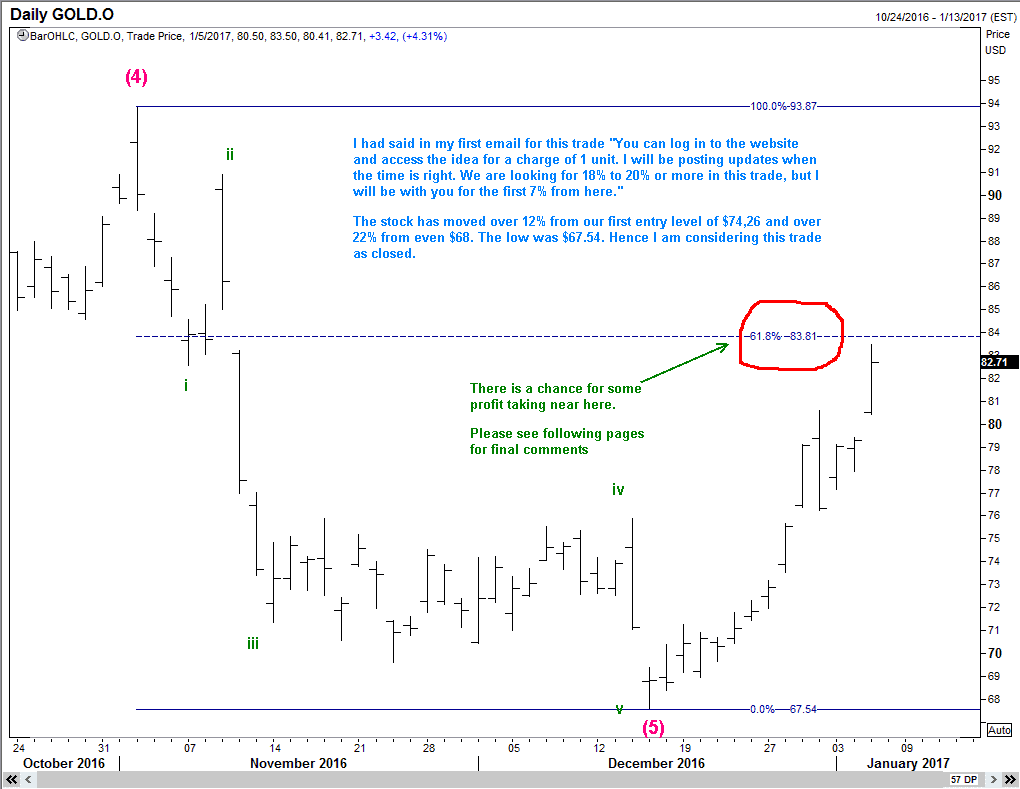
” You can log in to the website and access the idea for a charge of 1 unit. I will be posting updates when the time is right. We are looking for 18% to 20% or more in this trade, but I will be with you for the first 7% from here.”

The case was made for the trade with the charts in this link:

http://tinyurl.com/h6ayfy9

Subsequently, members were shown the possibility of a dip to $67 levels and were urged to buy more there.

Below are some of the more recent comments that members received:
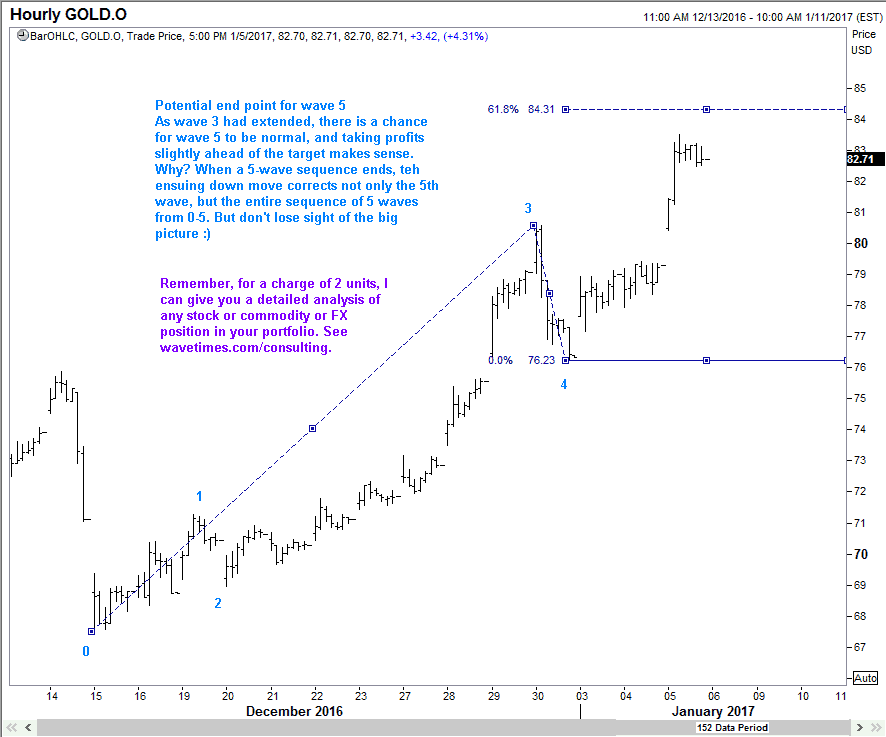
On 30 Dec 2016

randgold29dec2016

And today, 6 Dec 2017

randgold6jan2017

randgold6jan2017b


wave 4 in RandGold
wave 4 in RandGold

randgold6jan2017d


Nasdaq: GOLD.O Randgold Resources
Share. Facebook Twitter Pinterest LinkedIn Tumblr Telegram Email
Previous ArticleToshiba Corp News – The Magic of Extended Wave 5
Next Article BHP ready to dive or roar?
Ramki
  • Website

Related Posts

Has Meta (Facebook) stock seen the bottom

March 21, 2022

What Is The Nearest Technical Support For Meta (NASDAQ: FB)

February 7, 2022

Hedge Funds and Elliott Waves – Netflix $NFLX

January 17, 2022
View 6 Comments

6 Comments

  1. Malik Imran on January 7, 2017 6:22 pm

    Sir,
    Well explained. Thank you!!!

    Malik

    Reply
  2. Sam on January 27, 2017 1:04 am

    Dear Ramki, I bought your ebook ‘Five Waves to Financial Freedom” way back when and also downloaded a subsequent update to it. The BEST $10, I have ever spent – the knowledge I have gained from this tiny price is worth its weight in gold. I have subsequently added to my knowledge from other sources, but the original is still valid. I only have notes I made from the ebook and do not have access to the ebook anymore. I might buy it again, just for keeps sake.

    A question, please. In the book you have said to the effect that “the correction that happens after a 5 wave move will be larger than either wave 2 or wave 4”. I have always had a question and have not found an answer anywhere on the big net. The question is. by “larger” do you mean in magnitude only or also in time, please?

    I would sincerely appreciate your guidance on this.

    Thanks, Sam

    Reply
    • Ramki Ramakrishnan on January 28, 2017 2:56 pm

      Sam, By larger, I mean both in time and distance. Also, it can take the larger distance from one of the 2 corrections and the longer duration from the other correction.

      Reply
  3. Sam on January 29, 2017 5:54 am

    Thank you very much, Ramki. Much appreciated. It has been four or more years since I bought your ebook, made tons of notes and studied time and time again. Out there on the internet, there is so much fallacy with regards to EWT. My main source of study has been my notes from your book, reinforced with the archived chart analysis in your blog. Has stood me in good stead. Very best regards, Sam.

    Reply
    • Ramki Ramakrishnan on February 1, 2017 2:00 pm

      Sam, I am very glad that FWTFF remains a useful reference book. Perhaps you might consider posting a review on Amazon.com!
      Regards

      Reply
  4. Sam on March 18, 2017 8:47 pm

    Gave a good review that it so richly deserves.
    https://www.amazon.com/Five-Waves-Financial-Freedom-Analysis-ebook/product-reviews/B005JC5WWU/

    Reply

Leave A Reply Cancel Reply

Recent Posts
  • Has Meta (Facebook) stock seen the bottom
  • What Is The Nearest Technical Support For Meta (NASDAQ: FB)
  • Using Elliott Waves to Capture a Trade in S&P500
  • Hedge Funds and Elliott Waves – Netflix $NFLX
  • When Elliott Waves applauds the promoter’s signals!

WaveTimes is a Research Organization dedicated to providing original analysis, reports, reviews, and insights on developments in mutual funds, stocks, investing, foreign exchange, commodities, and bonds.

Contact WaveTimes

L-601 Mantri Espana,

Kariyammana Agrahara, Bellandur, Bangalore 560103

Follow Us

  • Facebook
  • YouTube
  • Twitter

© 2023 Wave Times. All Rights Reserved.
  • About
  • Books
  • Privacy Policy
  • Policies and Standards

Type above and press Enter to search. Press Esc to cancel.