• About
  • Elliott Waves
    • Elliott Waves Explained
    • Elliott Wave Magic Illustrated with Wave Charts
    • Elliott Wave Edge – How Elliott Wave Traders Win
    • Fibonacci Number Series and Elliott Waves
    • How to use Fibonacci Ratio Retracements
    • Elliott Wave Books
      • The Elliott Wave Book – Five Waves to Financial Freedom
      • Dividend Growth Investing Using Elliott Waves
    • Videos
  • Equities
    • Indices
      • Africa
        • Egypt
      • Australia
      • European Indices
        • AEX – Index, Amsterdam
        • DAX Index
        • Istanbul
        • Russia
        • Spain’s IBEX 35
      • Asian Indices
        • India
        • China
        • Dubai
        • Kuwait
        • Kuala Lumpur
        • Pakistan
        • Saudi
        • Taiwan
      • US Indices
        • S&P500
        • Nasdaq
        • Dow Jones
        • Dow Jones Utilities
    • Stocks
      • Asian Stocks
        • Indian Stocks Trading
        • Dubai Stocks Outlook
        • Japanese Stocks
        • Kuwait stocks
        • Saudi Stocks Outlook
      • African Stocks
        • Egyptian Stocks
      • Swiss Stocks
      • Australian Stocks
      • European Stocks
      • US Stocks outlook
      • UK Stocks
  • Commodities
    • Copper
    • Gasoline
    • Gold
    • Natural Gas
    • Oil
    • Palm Oil
    • Raw Sugar
    • Rubber
    • Soybean Oil
    • Silver
  • Forex
    • AUD
    • Bitcoin
    • CAD
    • CHF
    • Euro
    • GBP
    • INR
    • NZD
    • JPY
  • Raves
  • Consulting
    • Consulting
  • Ramki’s Watchlist
Top News

Has Meta (Facebook) stock seen the bottom

March 21, 2022

What Is The Nearest Technical Support For Meta (NASDAQ: FB)

February 7, 2022

Using Elliott Waves to Capture a Trade in S&P500

January 27, 2022
Facebook Twitter Instagram
WaveTimes Blog WaveTimes Blog
Wave times
  • About
  • Elliott Waves
    • Elliott Waves Explained
    • Elliott Wave Magic Illustrated with Wave Charts
    • Elliott Wave Edge – How Elliott Wave Traders Win
    • Fibonacci Number Series and Elliott Waves
    • How to use Fibonacci Ratio Retracements
    • Elliott Wave Books
      • The Elliott Wave Book – Five Waves to Financial Freedom
      • Dividend Growth Investing Using Elliott Waves
    • Videos
  • Equities
    • Indices
      • Africa
        • Egypt
      • Australia
      • European Indices
        • AEX – Index, Amsterdam
        • DAX Index
        • Istanbul
        • Russia
        • Spain’s IBEX 35
      • Asian Indices
        • India
        • China
        • Dubai
        • Kuwait
        • Kuala Lumpur
        • Pakistan
        • Saudi
        • Taiwan
      • US Indices
        • S&P500
        • Nasdaq
        • Dow Jones
        • Dow Jones Utilities
    • Stocks
      • Asian Stocks
        • Indian Stocks Trading
        • Dubai Stocks Outlook
        • Japanese Stocks
        • Kuwait stocks
        • Saudi Stocks Outlook
      • African Stocks
        • Egyptian Stocks
      • Swiss Stocks
      • Australian Stocks
      • European Stocks
      • US Stocks outlook
      • UK Stocks
  • Commodities
    • Copper
    • Gasoline
    • Gold
    • Natural Gas
    • Oil
    • Palm Oil
    • Raw Sugar
    • Rubber
    • Soybean Oil
    • Silver
  • Forex
    • AUD
    • Bitcoin
    • CAD
    • CHF
    • Euro
    • GBP
    • INR
    • NZD
    • JPY
  • Raves
  • Consulting
    • Consulting
  • Ramki’s Watchlist
WaveTimes Blog WaveTimes Blog
Home » Qua Vadis NSEI?
India

Qua Vadis NSEI?

RamkiBy RamkiApril 4, 201120 Comments1 Min Read
Facebook Twitter LinkedIn Telegram Pinterest Tumblr Reddit WhatsApp Email
Share
Facebook Twitter LinkedIn Pinterest Email

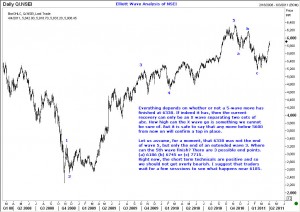
Everything depends on whether or not a 5-wave move has finished at 6338. If indeed it has, then the current recovery can only be an X wave separating two sets of abc. How high can the X wave go is something we cannot be sure of. But it is safe to say that any move below 5600 from now on will confirm a top in place.

Let us assume, for a moment, that 6338 was not the end of wave 5, but only the end of an extended wave 3. Where can the 5th wave finish? There are 3 possible end points. (a) 6186 (b) 6745 or (c) 7715.
Right now, the short term technicals are positive and so we should not get overly bearish. I suggest that traders wait for a few sesssions to see what happens near 6185. There will be several low-risk trades in the future, and it is better to wait for a clear signal (such as the one that emerged when the index traded below 6069 earlier this year) before risking hard-earned money in the markets.

Share. Facebook Twitter Pinterest LinkedIn Tumblr Telegram Email
Previous ArticleWrong-footed on DLF
Next Article TCS stock revisited
Ramki
  • Website

Related Posts

How Elliott Waves helped WaveTimes members to exit before the stock market crash

March 27, 2020

How we traded Castrol India using Elliott Waves

December 9, 2019

Nifty rallied up in 5 waves

July 10, 2015
View 20 Comments

20 Comments

  1. Pankaj on April 4, 2011 1:58 pm

    can the 5th wave finish below 3rd wave at 6186 ?

    Reply
    • Ramki on April 4, 2011 9:57 pm

      Pankaj, Yes, we can have the fifth finish below the 3rd if the 5th wave will be a ‘failed fifth’, but it needs to have 5 waves within it. Please bear in mind that I have not changed my count yet. I still believe that a 5-wave move is already over, and the current recovery is an X wave. However, I am urging caution if one is contemplating a short here because the indicators are currently positive. Let us wait for that to change and then we can think of selling.

      Reply
  2. abhinav on April 4, 2011 8:19 pm

    sir might be possible we are in gartley pattern and as per it nifty should retrace78.6% from top 6332 to bottom 5175 i.e upto 5965 what’s your opinion……

    Reply
    • Ramki on April 4, 2011 9:58 pm

      Abhinav, the possibilities are endless. I would stick to ONE count until proved wrong

      Reply
  3. vidhan on April 4, 2011 9:17 pm

    Ramki,
    Gartley Pattern on Nifty(spot) charts gave a target of approx 5945 from the lows of 5177. If Nifty reverses the target is 4400.

    Reply
    • Ramki on April 4, 2011 10:00 pm

      Vidhan, my responses elsewhere would cover your comment. Stick with one count, wait for sentiment to turn, and join in when trend is confirmed. Most important, choose low-risk levels to enter so that your stops are affordable.

      Reply
  4. vidhan on April 5, 2011 9:26 pm

    Sir, Nifty(spot) has posted an intra day high of 5944.45 few minutes back very close to my target of 5945. Point to exit longs .

    Reply
    • Ramki on April 7, 2011 6:24 am

      Vidhan, just like I am bearish for TCS down to 835, I continue to wait for Nifty to reach 4800 level before I will enter the Indian market on the long side. Be aware that there are supports at 5785, 5755 and 5710

      Reply
  5. K P Ganesh on April 6, 2011 3:32 am

    Looks like it’s VADE RETRO for Nifty to new highs. From what I could infer from the charts, Nifty seems to be forming Wave 1 inside Wave 5, inside Super Cycle degree Wave 5. And if my analysis is right then Nifty should reach 6569.80 (Taking intraday high of 5310.85 formed on 06/01/2010 and intraday low of 3918.75 on 13/07/2009 as Wave A inside the 5th wave = Wave C starting at intraday low of 5177.7 on 11/02/2011) and end the super cycle degree 5 wave up move spanning 21 years, close to the summation series of 6765 (6745 as mentioned by Mr. Ramki). Please forgive me if my analysis is wrong. As they say ERRARE HUMANUM EST.

    Reply
    • Ramki on April 6, 2011 9:43 pm

      Hi Ganesh, Are you also a student of Literature! I’m impressed with your language.

      Reply
      • K P Ganesh on April 7, 2011 9:24 am

        Que Pasa Senor Ramki.!!! How was your 2 week vacation in India. Not a student of literature. But a great fan of the ASTERIX comic books. My Spanish, Latin et al comes from them. Not bad, Amigo!!!

        Reply
  6. hemin on April 6, 2011 5:00 am

    Sir,

    TATA CONSULTANCY SERVICES (TCS)
    any wave count change because tcs make anew high

    please give us road map

    Reply
  7. BJ on April 7, 2011 10:42 pm

    Dear Ramki,

    2 questions – double zig zags are formed when the first zig zag does not reach the normal retracement. The previous 4th area of 5400-4700. And the January low of 5177 is with in this region. Should the retracement hit the lower regions of the previous 4th and then only decline is considered normal?
    Does the c with in the X also form 5 waves?

    Best regards,
    BJ

    Reply
    • Ramki on April 8, 2011 12:03 am

      BJ, your questions are very pertinent. Thank you. Typically when wave A of a FOURTH wave unfolds into 5 waves AND falls short of its normal retracement level, then one will look for a double zigzag. However, when an extended fifth wave is finished, we often encounter what is known as a double retracement. When the first move down does not travel to its normal corrective level, we should expect a second retracement that could even take the market all the way back to its top. BUt that does not change the expectation for an even stronger selloff to the ideal downside target (in our case 4800). NOw, as bthe first move down has been a zigzag, it is reasonable to look for an X wave and then another zigzag down. This X wave, as I said, is capable of moving all the way back to the top, but not necessarily so. There is no way of saying what formation the X wave will take. The X wave itself could have its own double zig zag, flats, triangles etc. Any C wave within the X wave will be made up of 5 sub waves. Hope all this is clear. I suggest you go back to the text books and read carefully, slowly to understand what I am trying to say. In brief, (a) I dont know how high the X wave will go, (b) But no matter how high it goes, I still expect a move down to 4800 and (c) I will play from the long side only after we get that downmove because when the sell off starts, it will be a very fast downmove, and I dont wish to get caught long at that time.

      Reply
  8. jagy on April 8, 2011 7:02 am

    dear ramki,

    As per my count Nifty follwing 3-3-5 flat correction. Out of which wave 3-3 over and wave 5 in progress. In wave 5 wave 1 over at 5177 and wave 2 target acheived at5945. Its start of tsunami wave 3 with target of 4300(1.618) > What is your comment on the same?

    Reply
    • Ramki on April 8, 2011 11:42 am

      Jagy, In a flat correction, the C wave will finish about the region where the A wave finishes. I dont see that here.

      Reply
  9. jagy on April 10, 2011 7:38 am

    DEAR SIR,
    I changed my nifty count after your valuable advice and i was awestruck by your deep insight on the market. Keep it up sir. You are giving valuable advice to young technical analyst aspirants.
    Can we say that Nifty wave X over at 5945. Now wave A shall unfold. If wave A unfolds what might be the target for wave A downmove from wave x top of 5945 as per neowave elliot wave theory. I am asking this question as i am badly trapped at 5500 nifty future april series. Please advice me on the same.

    Reply
  10. Pankaj on April 13, 2011 10:19 am

    If one had sold Nifty when 6069 was broken. When should he have booked profits and why? Should he have trailed his stops, if yes.. how?

    Reply
  11. DEEPAK on April 19, 2011 1:08 am

    Dear Sir,
    I am new to the elliot wave users family
    I was of view that can’t the a-b-c wave marked by you be marked as one complete wave ‘a’ with 3 wave down side & the recent upmove as wave ‘b’ to test the down sloping trendline from the top of 6340 & then downward movement for wave ‘c’ after testing the downward sloping trendline from the top.

    Reply
    • Ramki on April 19, 2011 7:49 am

      Deepak, Looks like we both agree on the larger direction! However, when you get a 3-wave downmove and wish to label it as wave ‘a’, the next move in the opposite direction, ie wave ‘b’ in your case should go back to the start of wave ‘a’. Such a correction will be called a flat correction. If we wish to allow wave ‘b’ to finish lower that near the prior top, then we have to look for a double zig-zag.

      Reply

Leave A Reply Cancel Reply

Recent Posts
  • Has Meta (Facebook) stock seen the bottom
  • What Is The Nearest Technical Support For Meta (NASDAQ: FB)
  • Using Elliott Waves to Capture a Trade in S&P500
  • Hedge Funds and Elliott Waves – Netflix $NFLX
  • When Elliott Waves applauds the promoter’s signals!

WaveTimes is a Research Organization dedicated to providing original analysis, reports, reviews, and insights on developments in mutual funds, stocks, investing, foreign exchange, commodities, and bonds.

Contact WaveTimes

L-601 Mantri Espana,

Kariyammana Agrahara, Bellandur, Bangalore 560103

Follow Us

  • Facebook
  • YouTube
  • Twitter

© 2023 Wave Times. All Rights Reserved.
  • About
  • Books
  • Privacy Policy
  • Policies and Standards

Type above and press Enter to search. Press Esc to cancel.