• About
  • Elliott Waves
    • Elliott Waves Explained
    • Elliott Wave Magic Illustrated with Wave Charts
    • Elliott Wave Edge – How Elliott Wave Traders Win
    • Fibonacci Number Series and Elliott Waves
    • How to use Fibonacci Ratio Retracements
    • Elliott Wave Books
      • The Elliott Wave Book – Five Waves to Financial Freedom
      • Dividend Growth Investing Using Elliott Waves
    • Videos
  • Equities
    • Indices
      • Africa
        • Egypt
      • Australia
      • European Indices
        • AEX – Index, Amsterdam
        • DAX Index
        • Istanbul
        • Russia
        • Spain’s IBEX 35
      • Asian Indices
        • India
        • China
        • Dubai
        • Kuwait
        • Kuala Lumpur
        • Pakistan
        • Saudi
        • Taiwan
      • US Indices
        • S&P500
        • Nasdaq
        • Dow Jones
        • Dow Jones Utilities
    • Stocks
      • Asian Stocks
        • Indian Stocks Trading
        • Dubai Stocks Outlook
        • Japanese Stocks
        • Kuwait stocks
        • Saudi Stocks Outlook
      • African Stocks
        • Egyptian Stocks
      • Swiss Stocks
      • Australian Stocks
      • European Stocks
      • US Stocks outlook
      • UK Stocks
  • Commodities
    • Copper
    • Gasoline
    • Gold
    • Natural Gas
    • Oil
    • Palm Oil
    • Raw Sugar
    • Rubber
    • Soybean Oil
    • Silver
  • Forex
    • AUD
    • Bitcoin
    • CAD
    • CHF
    • Euro
    • GBP
    • INR
    • NZD
    • JPY
  • Raves
  • Consulting
    • Consulting
  • Ramki’s Watchlist
Top News

Has Meta (Facebook) stock seen the bottom

March 21, 2022

What Is The Nearest Technical Support For Meta (NASDAQ: FB)

February 7, 2022

Using Elliott Waves to Capture a Trade in S&P500

January 27, 2022
Facebook Twitter Instagram
WaveTimes Blog WaveTimes Blog
Wave times
  • About
  • Elliott Waves
    • Elliott Waves Explained
    • Elliott Wave Magic Illustrated with Wave Charts
    • Elliott Wave Edge – How Elliott Wave Traders Win
    • Fibonacci Number Series and Elliott Waves
    • How to use Fibonacci Ratio Retracements
    • Elliott Wave Books
      • The Elliott Wave Book – Five Waves to Financial Freedom
      • Dividend Growth Investing Using Elliott Waves
    • Videos
  • Equities
    • Indices
      • Africa
        • Egypt
      • Australia
      • European Indices
        • AEX – Index, Amsterdam
        • DAX Index
        • Istanbul
        • Russia
        • Spain’s IBEX 35
      • Asian Indices
        • India
        • China
        • Dubai
        • Kuwait
        • Kuala Lumpur
        • Pakistan
        • Saudi
        • Taiwan
      • US Indices
        • S&P500
        • Nasdaq
        • Dow Jones
        • Dow Jones Utilities
    • Stocks
      • Asian Stocks
        • Indian Stocks Trading
        • Dubai Stocks Outlook
        • Japanese Stocks
        • Kuwait stocks
        • Saudi Stocks Outlook
      • African Stocks
        • Egyptian Stocks
      • Swiss Stocks
      • Australian Stocks
      • European Stocks
      • US Stocks outlook
      • UK Stocks
  • Commodities
    • Copper
    • Gasoline
    • Gold
    • Natural Gas
    • Oil
    • Palm Oil
    • Raw Sugar
    • Rubber
    • Soybean Oil
    • Silver
  • Forex
    • AUD
    • Bitcoin
    • CAD
    • CHF
    • Euro
    • GBP
    • INR
    • NZD
    • JPY
  • Raves
  • Consulting
    • Consulting
  • Ramki’s Watchlist
WaveTimes Blog WaveTimes Blog
Home » Qua Vadis NSEI?
India

Qua Vadis NSEI?

RamkiBy RamkiAugust 30, 201146 Comments2 Mins Read
Facebook Twitter LinkedIn Telegram Pinterest Tumblr Reddit WhatsApp Email
Share
Facebook Twitter LinkedIn Pinterest Email

I suggest that you read this even if you have no interest in Indian Stock markets! There are always learning opportunities.

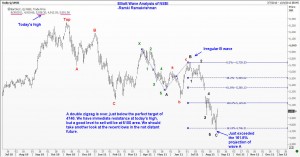
“Qua Vadis” or “Where are you going” NSEI is the question uppermost on traders’ mind in India. Having reached 4800, and wiping away the small time traders (who dared to stick on to their stale longs) by falling briefly to 4711, the index has rallied quite smartly in the last few sessions. But I would like to sound the alarm bells here if you are thinking the worst is over. We should get at least one more dip to test the lows again, potentially even breaking it. There is immediate resistance at today’s high around 5040, and beyond that at 5100/05. Although the prior fourth wave at 5190 area will become a reflex point (read more about the importance of reflex points on my book: Five Waves to Financial Freedom, it is likely we will fail to reach that high. Even if it does, you will see it come down sufficiently to take profits on any shorts you may have at or above 5100. Those who are thinking of buying for the medium term should continue to be patient. Bear market rallies such as these have a habit of abruptly turning around. Good luck.

NSEI
Share. Facebook Twitter Pinterest LinkedIn Tumblr Telegram Email
Previous ArticleTransform your Trading!
Next Article Five Waves to Financial Freedom
Ramki
  • Website

Related Posts

How Elliott Waves helped WaveTimes members to exit before the stock market crash

March 27, 2020

How we traded Castrol India using Elliott Waves

December 9, 2019

Nifty rallied up in 5 waves

July 10, 2015
View 46 Comments

46 Comments

  1. Vishal G Ruparel on August 30, 2011 4:42 am

    Thanx Ramki,any downside targets if we break 4711,if it breaks we will be flirting dangerously to the election gap

    Reply
  2. Sridhar on August 30, 2011 8:12 am

    Ramki, would it be possible for you to explain this from a wave perspective? After completion of the double zigzag, what wave structure would lead to a retest of the lows?

    Reply
    • Ramki on August 30, 2011 11:41 pm

      Hi Sridhar, As even a double zigzag is considered a complex correction, it will be vain on our part to describe what formations the next leg down could take. It could be that we won’t break down to new lows, but just approach near the recent lows. We will have to deal with it as it unfolds. All I can say now is if we are looking to play from the BUY side then we will get better levels to enter than now.

      Reply
  3. Abhinav Jain on August 31, 2011 12:43 am

    Sir,
    Where you have finished “C” i m counting there wave 3rd have finished. It is exactly 423.6% of wave 1 (5740 to 5496). In this extended 3rd wave, wave V is also extended and its (ii) wave end at 5111, so as of now wave larger 4th is running and will face resistance at 5100-5150 level (wave (ii) level). also this level is 38.2% retracement of whole 3rd wave (5591 to 4720) Pls comment can it be right counting…

    Reply
    • Ramki on August 31, 2011 5:45 am

      Abhinav, that’s very good counting. I will be even more pleased if you tell me you learned how to do this from wave times and the book!

      Reply
      • vijayanand on October 3, 2011 6:08 am

        Ramki sir,
        I am new to this website… please advice and guide me with ur views…

        Reply
        • Ramki on October 3, 2011 12:37 pm

          Hello Vijayanand, welcome to the club! I suggest that you take your time to browse the site and gain a broad understanding of the concepts. Gradually you will begin to appreciate new comments as they appear. Good luck!

          Reply
  4. Daxit on August 31, 2011 4:47 am

    Hi Ramki, how to participate in bull/bear market using Elliot wave theory because many Analyst went wrong in 2008 by suggesting Nifty likely to test 1860 if break 2550 lvl & According to Elliot wave theory Nifty confirms buy only abv 3280 lvl means almost 25-30% higher from bottom. so how & when one should book profit if any person only follow Elliot wave theory for trading……can u show the future of nifty with “IF & THAN” condition?Thanks in advance

    Reply
    • Ramki on August 31, 2011 5:50 am

      Hi Daxit, may I suggest that you read a good book on Elliott Wave Principle, and start analyzing the market yourself? Then you will know a low risk level to buy without relying on half-baked ideas from others. Where possible, my blog will also give some clues, but nothing beats doing it yourself.

      Reply
  5. Pasupathi on August 31, 2011 6:27 am

    Hi Ramki,My count says that wave 3 of C finished at 4796 and the new low made is the b wave of expanded flat and now we are seeing the wave c of 4 of C. I expect a new low to be made in next few weeks before we see a good bottom in nifty.
    Pls comment.

    Reply
    • Ramki on August 31, 2011 6:43 am

      Pasupathi, you guys make me proud. This count is also possible. Which one is the correct one will depend on the internal waves of the current rally. If it is made up of 3 waves, then Abhinav’s count is correct. If it is made up of 5 waves, then your count is correct. But either way, the conclusion is we are likely to get one more downmove. Your trading strategy will be governed by your individual count. ie, your entry and your stop loss levels. This is what I am trying to teach you in the book. You can have different counts and still make profits. Importantly, you should follow your own analysis, not depend on others because you will now know where to exit if your count is wrong! If you like this comment, please tell all your friends about how wavetimes is different from the incessant chatter you hear elsewhere in the marketplace

      Reply
  6. Deepak on August 31, 2011 8:13 am

    Dear Sir,
    First of all Thanks for ur guidance for Indian guys.I m really impressed by ur predictions.I have also started to study on Elliott wave analysis.I m new learner of Elloitt wave analysis.As per my study on daily chart of Nifty I think pullback of 3rd wave will be in range of 5150-5200 (as per Fibo. retracement from wave 2).5th wave will be end on 4060.
    Pls comment on this so that I can improve my study.Thanks again……….

    Reply
    • Ramki on August 31, 2011 8:16 am

      Deepak,
      Any number of counts are possible. Just be consistent till the time you are proved wrong. But be faithful to the rules and guidelines explained in my book. Good luck

      Reply
  7. Dr.jignesh shah on September 2, 2011 10:57 pm

    Dear Ramki,
    my interesting observation about waves.
    I feel that we were in double zigzag with A1-B1-C1-X-A2-B2-C2.

    ****Now interesting observation was that
    –A1 and A2 were almost similar(around 700 points) as A1 formed from 6339 to 5690 and A2 from 5944 to 5196.
    –B1 and B2 were also similar (around 500 points) as B1 formed from 5690 to 6181 and B2 from 5196 to 5740.
    –C1 and C2 were also similar(around 1000 points) as C1 was from 6181 to 5177 and C2 was from 5740 to 4720.

    Now I think we should consolidate here in some short of triangle if it is double zigzag then move higher, so I also feel that we will get two or three opportunity to buy near 4700-4800.

    Reply
  8. vikas on September 3, 2011 7:20 am

    Dear Sir,

    firstly thanks for this wonderful forum which provides us with guidance and your mentorship. I had been following your forum for few months and bought the book today.

    I had a question that besides the wave counts relationship with fibonacci no.s which can help in predicting the new levels of support and resistances… are the waves not time dependent.. looking forward to your feedback to improve…

    Reply
  9. Pravin on September 4, 2011 8:03 pm

    Hello Ramki,

    Got the book on kindle few days back. It is very informative. As far as i am concerned i am reading it very slowly and trying to locate examples for each formation in nifty and other stock charts. I know it may take time since one needs to develop an eye for the same.
    Can you throw some light about the time correlations. For ex. after five waves up are complete, what is the time range for the correction to get over. I have been looking various charts for long time and found that this time can vary anywhere between 30 -50% of the taken for up move.

    Request you comments.

    Regards,

    Pravin

    Reply
  10. Riddhi on September 8, 2011 12:07 am

    Hello Sir,

    Have read few sentence from a blog and am putting it here. Pls guide abt it if time permits.

    DAX is achieving the triple divergence in momentum only now, Nifty did that at 4750. Dont drive by looking at the rear view mirror. We may see 5450-5500 soon.

    Thanks,

    Riddhi.

    Reply
    • Ramki on September 8, 2011 12:58 am

      Hello Riddhi, My suggestion is you should not read too many people. We do not know what methods others are following. Your best bet is to learn any one technique and use it consistently.

      Reply
    • abhinav jain on September 8, 2011 9:07 am

      Ridhi,
      I think here blog writer is talking about RSI divergence because its the one which showed in Nifty EOD chart while it was trading near 4750.
      It means RSI making higher low and price making lower low.

      Reply
  11. Manish on September 8, 2011 10:24 pm

    sir,

    could you put an updated chart.
    congratulations on your Book.

    Reply
  12. Rajendra on September 12, 2011 7:38 am

    As per guidance through book “Five Waves to Financial Freedom” today from the reflex point 5172 nifty achieved its target of 4944 successfully as per Fibonacci retracement , Nifty made a low of 4911. What i have to implement now ?

    Reply
    • Ramki on September 12, 2011 11:23 am

      Rajendra, the future is in your hands now. Figure it our yourself and see if things evolve as you thought it might! When you gain in confidence you can real money innards small way.

      Reply
  13. Rk on September 14, 2011 7:06 pm

    Hello sir, congrats for ur book it will become very usefull for the people like me. I want to ask 1 que. Should we consider this correction as 6339-5177 (A) 5177-5944 (B) & from 5944 it will take shape (abc x abc)? If 5196 break on upside it will rejects the 5wave down as (C) wave. We can consider even 5177 as 1st wave of 5 in worst condition. Is my understanding right sir? My preferred view is 50% retracement price wise as well as time wise i will follow it objectively. Ur thought on this sir.

    Reply
  14. vivek on September 15, 2011 8:20 am

    sir, gone through your book. amazing thing about it is its very simple to understand ewp and apply ewp for making low risk trades. thanks a lot for writing such wonderful a book.
    sir will you please see NSEI chart? is there X wave unfolding, correcting recent downmove ?

    Reply
  15. Rajesh on September 15, 2011 10:18 am

    Getting confused. Nifty is in a zigzag movement now. Morning up and afternoon Down and vice versa. What to expect now?

    Reply
  16. Vishal G Ruparel on September 16, 2011 10:53 am

    Your views on Nifty india will be largely appreciated it’s being going above 5100 regularly but unable to sustain

    Reply
  17. Ramki on September 18, 2011 1:23 am

    Vishal, you will have to watch the reflex point at 5190 as suggested in my last update.

    Reply
  18. Rajesh on September 18, 2011 5:09 am

    Some raw calculation, I have made. Pl. guide.

    a= 6338 to 5690= -648
    b= 5690 to 6181= 491
    c=A= 6181 to 5177= -1004
    B= 5177 to 5944= 767
    C1= 5944 to 5196= -748
    C2= 5196 to 5740= 544
    C3= 5740 to 4720= -1020
    C4 (i)= 4720 to 5169= 449
    C4 (ii)= 5169 to 4902= -267
    Now we are in C4(iii). Possibilities are,
    1. C4(iii)= C4(i)*.707= 317.443+ 4902= 5219.443
    2. C4(iii)= C4(i)*.618= 277.482+4902 = 5179.482
    3. C4= C3*.5= 510+4720= 5230
    4. C4= C3*.382= 389.64+4720= 5109.64
    Option 1 & 3 match at 5220/5230. But this will then cross the reflex point at 5180/5190. What will be the outcome if it crosses this reflex point.

    Reply
    • Ramki on September 18, 2011 10:59 am

      Rajesh, I must apologize, but I am going to leave it to others to answer your question. Given my limited free time it is very difficult to go to such deatil again, much as I would like to help you in your learning process. Regards.

      Reply
  19. Soni Hitesh Kumar Maheshchandra on September 22, 2011 8:30 am

    Respected Sir,
    1. Your views on Nifty long term.
    2. When the market moves towordes upside & suddenly the news come in that case EW works or not.

    Reply
    • Ramki on September 22, 2011 9:26 pm

      Hi Soni, I have seen the market being sold after very good news too because it was already discounted ( and go up after bad news). EWP works all the time. But what you need to understand is EWP is not to be used as a forecasting tool, but as a trading aid.

      Reply
  20. meena on September 27, 2011 1:52 am

    Hi Sir,

    As suggested by you, we have made one more low in the level of 4750. Pleae help me to understand the current up move whether implusive cycle for the new trend (if this move cross above the reflex point of 5190) or we should treat this as X wave and expecting another correction? As i understand from elliot wave book, the combination of corrective waves are (zigzag + flat/triangle).
    Please guide us to understand the current up move.

    Meena

    Reply
    • Ramki on September 28, 2011 5:19 am

      Hi Meena,
      A move past the reflex point is a clarion call for you to start looking closely at that move to see if we got a 5 wave rally. If it is indeed a 5 wave rally, you will use the next (2nd wave) correction to buy. Hope that helps.

      Reply
  21. meena on October 4, 2011 2:09 am

    Hi Sir,

    Market is not move above the reflex point (5190). Market breaks the previous low of 4755 level. This gives us a clear message that the previous up move is not an implusive 5 wave structure (wave2 retraces more than 100% of wave1). Market takes support around 4717 level (ending of zigzag C wave move). Please guide us whether we can consider this move us Regular FLAT correction? I am not sure whether mutiple zipzag with flats are allowed. Please guide us.

    Meena

    Reply
    • Ramki on October 4, 2011 6:00 am

      Hello Meena, May I recommend that you read the book very carefully? The failure to overcome a reflex point does not imply that it was a correction. What I meant in the book is if you observe that the move has gone past a reflex pointm then you could count the waves to see if it was a 5 wave move….

      Reply
  22. Sandeep Arora on October 9, 2011 2:51 pm

    Sir Ramki,

    Firstly I want to thank you for sharing with us with your deep knowledge and experience through this blog.
    I have few questions related to the market and nifty50 as such:

    1. Do you see Nifty50 to jump a little bit(if yes to what levels) if in case you believe it has formed a short-term bottom?

    2. Also, I was trying to buy a hardcopy of your book but wasn’t able to. Any idea when I can catch hold of a hardcopy instead of a softcopy.

    3. The third is a request than a question. We all readers would like to read more updates from you related to the market. Would be great if you could update some of the indian stocks for all of us.

    Thanks in advance.

    Sandeep

    Reply
    • Ramki on October 10, 2011 12:02 am

      Hi Sandeep, Thanks for your comments. (1) EVen if Nifty recovers, it will likley run into significant trouble just below 5200. Early resistance lies at 4970. (2) My book is currently available only in soft copy because it has numerous internal hyperlinks that act as cross references – a valuable feature that will be lost in a paper edition (3) Given my full time job, it is difficult to do frequent updates, but will do my best

      Reply
  23. prithvi on October 11, 2011 9:22 pm

    Dear Ramki,

    Any update for Nifty??

    Reply
  24. vijayanand on October 12, 2011 8:46 am

    Ramki sir,
    I want to thank you for sharing your knowledge and experience through this blog.
    I have one questions related to market..

    Now market is in up trend…. So i want to know at which level Nifty will move around 5150 level or 5200 level ? which level is the down trend reversal possible…

    Reply
  25. Amit Shah on October 13, 2011 2:08 am

    Hello Sir,

    its nice to be here. i am a new elliot wave entusiast. looking forward for a gr8 learning expereince.

    cheers.

    Amit

    Reply
  26. Amit Shah on October 13, 2011 11:08 am

    Hello Sir,

    Its nice to have an expereinced person like you to share your knowledge & help ppl who want to learn.

    Cheers

    Amit

    Reply
  27. alpesh on October 14, 2011 5:48 am

    sir plz update nifty chart with “EW” & yr views…
    thx & regards,
    Alpesh

    Reply
  28. Times Nifty on October 14, 2011 11:49 pm

    Commendable job with the book – I am a CFA, FRM and CMT but my degrees are worth nothing compared to the high level of knowledge and expertise you have shared in this book.
    The simple approach and tactics has won the hearts of many including ours. Your vision has been intact and we promise, you will be remembered by many in our everyday lives. It’s my privilege to acknowledge your recent contribution to the youth in such a fashion.
    All of us here at TimesNifty hereby stand and applaud to your success and wish you have many more of these come your way 🙂
    Thank You again.

    Reply
    • Ramki on October 18, 2011 12:54 am

      Times NIfty, Thank you very much for your kind words

      Reply
  29. vijayanand on October 15, 2011 12:03 am

    Ramki Sir,
    I want to thank you for sharing with your deep knowledge and experience…

    I have one questions related to the nifty….

    Now nifty will uptrend…. it will continue are any breakout from 5150 -5170 level… can u clarify this sir..

    Reply
  30. vijaysinh on October 15, 2011 9:03 am

    sir ,what is your latest view on nifty?

    Reply

Leave A Reply Cancel Reply

Recent Posts
  • Has Meta (Facebook) stock seen the bottom
  • What Is The Nearest Technical Support For Meta (NASDAQ: FB)
  • Using Elliott Waves to Capture a Trade in S&P500
  • Hedge Funds and Elliott Waves – Netflix $NFLX
  • When Elliott Waves applauds the promoter’s signals!

WaveTimes is a Research Organization dedicated to providing original analysis, reports, reviews, and insights on developments in mutual funds, stocks, investing, foreign exchange, commodities, and bonds.

Contact WaveTimes

L-601 Mantri Espana,

Kariyammana Agrahara, Bellandur, Bangalore 560103

Follow Us

  • Facebook
  • YouTube
  • Twitter

© 2023 Wave Times. All Rights Reserved.
  • About
  • Books
  • Privacy Policy
  • Policies and Standards

Type above and press Enter to search. Press Esc to cancel.