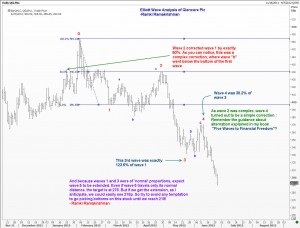
 There are strong Elliott Wave reasons to think Glencore stock (GLEN:LSE) is all set to continue its dive in the coming weeks. The decision by Qatar Holdinigs to seek improved merger terms sent shock waves up the spines of those who were hoping for some stability in Glencore’s stock price. Let us take a quick look at the chart of Glencore PLC and see what is in store.
ELliott Wave Theory says that any one impulse wave in a five wave sequence is likley to extend. Clearly, Waves 1 and 3 were both of normal proportions for Glencore. Thus, it looks like we should expect the selling to intensify, especially on any close below the 265p level. Why is the 265p level important? At that point, the stock would have reached its equality measure of the first major sell off from 559 to 341.
HOw can one trade this? I think any recovery to around 298 should be used to get out of stale longs. It is doubtful if we will close above 303 in the near term. As a first step, take partial profits below 277 and some more at 266. Once we get a clear break below 265, we should think of finding fresh levels to add to shorts. But for now, although we should be prepared for the worst (which is a 25% loss), let us be content with a 9-10% profit.

