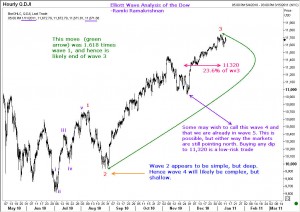
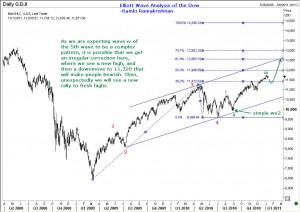
 The last time I looked at the chart for the Dow was back in May 2010, where I warned of a downmove to 9000 levels. The correction went only to 9600 area, (still a nice 11% down from the time of the update). Examining it with fresh eyes and more price action reveals that the top seen at that time was not the end of the 5th wave. (Readers should realize that traders need to actively engage in following their own markets in order to be successful. I am looking at it after 7 months and didn’t warn you of this change in count. But you could have easily spotted it with shorter term charts. Wavetimes is only a source of reference for you, to give you numerable examples of how to read the markets).
 The outlook for the Dow, in my view, is still positive in the bigger picture. We could see a bit of back-and-forth movement in the coming days because we are likley beginning a complex fourth wave. But later on the market will sort itself out, and a new upmove is likley to happen. The charts give more reasons. Enjoy.

