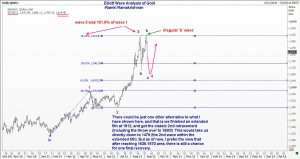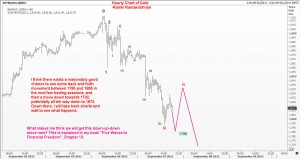
 Now that we have traded below 1835, many people are anxious to know how far it will go down. Like always, I prefer to ‘show’ you my analysis! There are two charts presented here. The first chart gives you an overview of the bigger picture, and identifies two possibilities, and what is my preference. The second chart is an hourly chart, where I have let my imagination take over (but within the boundaries of Elliott’s guidelines). If you have invested in my book, you should try and figure out the reasons for my levels yourself. That will be the way to learn the techniques first hand. Good luck. Ramki
Outlook for Gold – Elliott Wave Approach

Unleash your Potential
Transform your trading – Starting Today
