• About
  • Elliott Waves
    • Elliott Waves Explained
    • Elliott Wave Magic Illustrated with Wave Charts
    • Elliott Wave Edge – How Elliott Wave Traders Win
    • Fibonacci Number Series and Elliott Waves
    • How to use Fibonacci Ratio Retracements
    • Elliott Wave Books
      • The Elliott Wave Book – Five Waves to Financial Freedom
      • Dividend Growth Investing Using Elliott Waves
    • Videos
  • Equities
    • Indices
      • Africa
        • Egypt
      • Australia
      • European Indices
        • AEX – Index, Amsterdam
        • DAX Index
        • Istanbul
        • Russia
        • Spain’s IBEX 35
      • Asian Indices
        • India
        • China
        • Dubai
        • Kuwait
        • Kuala Lumpur
        • Pakistan
        • Saudi
        • Taiwan
      • US Indices
        • S&P500
        • Nasdaq
        • Dow Jones
        • Dow Jones Utilities
    • Stocks
      • Asian Stocks
        • Indian Stocks Trading
        • Dubai Stocks Outlook
        • Japanese Stocks
        • Kuwait stocks
        • Saudi Stocks Outlook
      • African Stocks
        • Egyptian Stocks
      • Swiss Stocks
      • Australian Stocks
      • European Stocks
      • US Stocks outlook
      • UK Stocks
  • Commodities
    • Copper
    • Gasoline
    • Gold
    • Natural Gas
    • Oil
    • Palm Oil
    • Raw Sugar
    • Rubber
    • Soybean Oil
    • Silver
  • Forex
    • AUD
    • Bitcoin
    • CAD
    • CHF
    • Euro
    • GBP
    • INR
    • NZD
    • JPY
  • Raves
  • Consulting
    • Consulting
  • Ramki’s Watchlist
Top News

Has Meta (Facebook) stock seen the bottom

March 21, 2022

What Is The Nearest Technical Support For Meta (NASDAQ: FB)

February 7, 2022

Using Elliott Waves to Capture a Trade in S&P500

January 27, 2022
Facebook Twitter Instagram
WaveTimes Blog WaveTimes Blog
Wave times
  • About
  • Elliott Waves
    • Elliott Waves Explained
    • Elliott Wave Magic Illustrated with Wave Charts
    • Elliott Wave Edge – How Elliott Wave Traders Win
    • Fibonacci Number Series and Elliott Waves
    • How to use Fibonacci Ratio Retracements
    • Elliott Wave Books
      • The Elliott Wave Book – Five Waves to Financial Freedom
      • Dividend Growth Investing Using Elliott Waves
    • Videos
  • Equities
    • Indices
      • Africa
        • Egypt
      • Australia
      • European Indices
        • AEX – Index, Amsterdam
        • DAX Index
        • Istanbul
        • Russia
        • Spain’s IBEX 35
      • Asian Indices
        • India
        • China
        • Dubai
        • Kuwait
        • Kuala Lumpur
        • Pakistan
        • Saudi
        • Taiwan
      • US Indices
        • S&P500
        • Nasdaq
        • Dow Jones
        • Dow Jones Utilities
    • Stocks
      • Asian Stocks
        • Indian Stocks Trading
        • Dubai Stocks Outlook
        • Japanese Stocks
        • Kuwait stocks
        • Saudi Stocks Outlook
      • African Stocks
        • Egyptian Stocks
      • Swiss Stocks
      • Australian Stocks
      • European Stocks
      • US Stocks outlook
      • UK Stocks
  • Commodities
    • Copper
    • Gasoline
    • Gold
    • Natural Gas
    • Oil
    • Palm Oil
    • Raw Sugar
    • Rubber
    • Soybean Oil
    • Silver
  • Forex
    • AUD
    • Bitcoin
    • CAD
    • CHF
    • Euro
    • GBP
    • INR
    • NZD
    • JPY
  • Raves
  • Consulting
    • Consulting
  • Ramki’s Watchlist
WaveTimes Blog WaveTimes Blog
Home » Outlook for Gold : 13 Dec 2010
Gold

Outlook for Gold : 13 Dec 2010

RamkiBy RamkiDecember 13, 201018 Comments1 Min Read
Facebook Twitter LinkedIn Telegram Pinterest Tumblr Reddit WhatsApp Email
Share
Facebook Twitter LinkedIn Pinterest Email


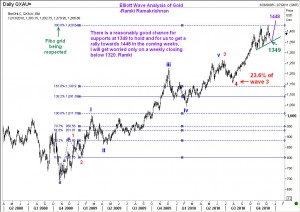
There have been several requests for my outlook on Gold. The attached chart gives you the Elliott Wave Analyst’s view of where the precious metal is likely to go in the coming weeks. As you can see, Gold has experienced a bout of profit-taking at the 300% fibonacci extension target. However, the current setback for Gold is still viewed only as a correction. During this phase, expect initial supports to come in around 1368, but the crucial support really lies at 1320. I expect Gold to find fresh buyers on any dip to 1349/50 levels, which is where a minor trendline support comes. The next rally will take us to new record highs, and will reach 1448. The technical equality target lies at 1460, and so we could experience a brief spike to that level, but at present, traders should be quite content with taking profits at 1448 or thereabouts. Thus, the forecast for Gold prices is to remain bullish, and buy on dips.

Forecast for Gold price Outlook gold
Share. Facebook Twitter Pinterest LinkedIn Tumblr Telegram Email
Previous ArticleUSD interest rate outlook 5 year dollar swap curve
Next Article Outlook for Citigroup : 14 Dec 2010
Ramki
  • Website

Related Posts

Elliott Wave analysis benefits a short term trader in XAU/USD

June 9, 2017

Elliott Wave Analysis of Gold

April 16, 2013

Elliott Wave Analysis of Gold – September 2012

September 9, 2012
View 18 Comments

18 Comments

  1. ajay on December 16, 2010 4:41 am

    dear sir merry xmas and happy new year can give us a count on gold how the wave is acting recently the correction seem very complex

    Reply
  2. sanjeev on December 17, 2010 4:17 am

    Sir,

    i want to learn more about elliott wave what to do ?

    Thanks

    Reply
    • Ramki on December 20, 2010 4:48 am

      Sanjeev,

      Start by reading a standard book on Elliott Wave Principle. (the one by Robert Precter is often recommended). You can then go through the hundreds of real-life examples in Wave Times. Gradually, you will recognize wave patterns in everything, and you are already on your way! Good luck

      Reply
  3. ajay on January 4, 2011 10:48 pm

    dear sir, i just want to know is there a diagonal triangle formation in gold if so after hittng 1424$ gold fell below 2.4% can we say that it was a final wave and now gold is going to tumble !”or can we we see another rally from 1375$

    Reply
  4. yasser on January 5, 2011 6:02 pm

    Dear Mr. Ramki,

    First would like to wish you a Happy New Year, and wish that 2011 is a much better year than previous years, full of joy, wealth and health.

    I have 2 requests Mr. Ramki and I be very much appreciated if you respond back.

    1. You have closed the comments on Dubai index page and on Saudi Stocks and if I’m not mistaken the same thing is on Saudi. These pages were last updated in May 2010. Apologies if I have date incorrect.

    My question or request, is that as long as you have a public blog, we as visitors and people who like to learn and read your analysis have the right to add comments within certain parameters our guidelines that should be respected, but closing the comments doesn’t let anyone to ask any question or add a comment, especially for those that are seeking education &/or advice, which I’m sure me and others have asked your update on Dubai, Saudi, & even Kuwait if I’m not mistaken through other pages in your blog for several months, but unfortunately we had no response.

    Whoever is interested in Dubai or UAE equities really want to see your views and analysis, as we ask you. because we trust your analysis and would love to read them.

    Mr. Ramki, my request is a favour to all those asking about Dubai Index or individual stocks to give them an update to know where we stand.

    2nd, sometimes I give my comments on your analysis, on a certain stocks or indices , unfortunately I find my comments deleted, and these comments really have nothing wrong with them, all they are just normal comments and views.

    Mr. Ramki appreciate your understanding and would be grateful if we can see and read your updated analysis on the GCC markets.

    Best Regards,
    Yasser

    Reply
    • Ramki on January 6, 2011 5:27 am

      Yasser, many thanks for your comments. (a) I have changed the settings to keep comments open indefinitely instead of closing after 30 days! (b) Your dates are probably correct I havent been posting for long on several instruments. It is just that I am so awfully busy with office work,and this blog is just a hobby, and a means to stay in touch with friends from around the world. (c) I never delete an honest comment, even if it is critical of me. Apologies if your posts have inadvertently been left out. Sometimes, I see the same person repeatedly asking for the same thing. If that comment doesnt add value to others, I might leave it out. (d) Finally, I will try and post something on the GCC next week. Best wishes for the new year too.

      Reply
  5. yasser on January 20, 2011 7:55 am

    Dear Ramki,

    Thank you for your reply, really appreciated, and will be looking forward to read your analysis on the GCC markets especially Dubai

    Mant thanks,
    Yasser

    Reply
  6. ajay on March 25, 2011 12:29 am

    hi sir how are you i hope you are fine sir kindly tell us when your reviewing your analysis for gold and silver for this year

    Reply
    • Ramki on March 25, 2011 6:39 am

      Hi Ajay, I will be back in Kuwait during the first week of April.

      Reply
  7. Kunal on April 5, 2011 8:51 am

    Dear Ramki,

    The Gold is very near the target price given by you. Would you please review this again.

    Reply
    • Ramki on April 7, 2011 6:36 am

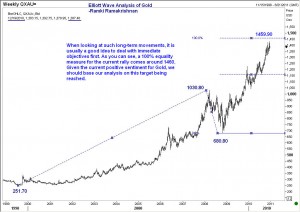
      Kunal, Thanks for pointing this out. I would like readers of this blog to understand one thing. The mere fact of having reached a certain target does not mean the move is over. Certainly one should not contemplate selling just because a technical target has been reached. Ofcourse, it is certainly possible that Gold might have finished (or close to finishing) its rally. But until the time we have evidence that a top is in place, we should be ever so cautious. There are some supports at 1445 levels, and I wouldn’t be surprised at all if we get another attempt higher while this support holds. Only after we see a new 5 wave downmove finish will I start thinking about putting out a sell recommendation. How is this different from TCS where I appear to be comfortable in maintaining a downside target even before the top is definitively posted? I really can’t explain it. Sometimes I just feel it so. I realize that this is not a sensible answer. Maybe it is because TCS is doing a second extension within its 5 wave upmove? OK. Let me just say this. Once Gold finishes this rally, we will commence a decline down to 1160. Hope that satisfies some of you!

      Reply
  8. pravin phatak on April 7, 2011 10:35 am

    Dear Mr. Ramki,
    I have been reading your posts regularly and find them very educative.
    Request your views on power finance and torrent power.
    These two stocks have been in down trend since long and have already retraced ~50 % or more as compared to the big run up they had.
    I would like to understand your views about these two.
    regards,

    Pravin Phata

    Reply
  9. Yasser on April 7, 2011 2:33 pm

    Dear Mr.. Ramki,

    Thank you again for these beautiful charts, always enjoy reading them, but still waiting for your promise in January regarding the GCC markets and especially Dubai market, so would really be grateful if you would give us your views.

    Appreciate you efforts and time, but your view is really important.

    Best Regards
    Yasser

    Reply
    • Ramki on April 7, 2011 11:28 pm

      Hi Yasser, I know I havent looked at GCC for long. Will post something next week

      Reply
  10. Kunal on April 10, 2011 10:29 am

    Thanks Sir for your insights.

    Reply
  11. Pingback: Elliott Wave Analysis of Gold | Elliott Wave Analysis & Trading Techniques Ramki - Wave Times

  12. hemin on April 14, 2011 4:30 am

    sir,
    sir you label as W-1(1005.40 )AND W-2(864.50)
    AND W-3(1226.10) AND W-4(1043.75)
    but their is no alteration between w-2 and w-4 or i can not see
    and how and where you measure for this target
    Sir. one request now please give us road map and wave count of silver

    Thanks

    Reply
    • Ramki on April 14, 2011 5:50 am

      Hemin, The alternation btw 2 and 4 is seen in the depth of correction here. Wave 2 was shorter. However, the alternation btw wave ii and wave iv (within the fifth wave) is different. Wave iv is complex (being an irregular wave)…We prepare for alternation, but cannot anticipate in what form it will show up.

      Reply

Leave A Reply Cancel Reply

Recent Posts
  • Has Meta (Facebook) stock seen the bottom
  • What Is The Nearest Technical Support For Meta (NASDAQ: FB)
  • Using Elliott Waves to Capture a Trade in S&P500
  • Hedge Funds and Elliott Waves – Netflix $NFLX
  • When Elliott Waves applauds the promoter’s signals!

WaveTimes is a Research Organization dedicated to providing original analysis, reports, reviews, and insights on developments in mutual funds, stocks, investing, foreign exchange, commodities, and bonds.

Contact WaveTimes

L-601 Mantri Espana,

Kariyammana Agrahara, Bellandur, Bangalore 560103

Follow Us

  • Facebook
  • YouTube
  • Twitter

© 2023 Wave Times. All Rights Reserved.
  • About
  • Books
  • Privacy Policy
  • Policies and Standards

Type above and press Enter to search. Press Esc to cancel.