• About
  • Elliott Waves
    • Elliott Waves Explained
    • Elliott Wave Magic Illustrated with Wave Charts
    • Elliott Wave Edge – How Elliott Wave Traders Win
    • Fibonacci Number Series and Elliott Waves
    • How to use Fibonacci Ratio Retracements
    • Elliott Wave Books
      • The Elliott Wave Book – Five Waves to Financial Freedom
      • Dividend Growth Investing Using Elliott Waves
    • Videos
  • Equities
    • Indices
      • Africa
        • Egypt
      • Australia
      • European Indices
        • AEX – Index, Amsterdam
        • DAX Index
        • Istanbul
        • Russia
        • Spain’s IBEX 35
      • Asian Indices
        • India
        • China
        • Dubai
        • Kuwait
        • Kuala Lumpur
        • Pakistan
        • Saudi
        • Taiwan
      • US Indices
        • S&P500
        • Nasdaq
        • Dow Jones
        • Dow Jones Utilities
    • Stocks
      • Asian Stocks
        • Indian Stocks Trading
        • Dubai Stocks Outlook
        • Japanese Stocks
        • Kuwait stocks
        • Saudi Stocks Outlook
      • African Stocks
        • Egyptian Stocks
      • Swiss Stocks
      • Australian Stocks
      • European Stocks
      • US Stocks outlook
      • UK Stocks
  • Commodities
    • Copper
    • Gasoline
    • Gold
    • Natural Gas
    • Oil
    • Palm Oil
    • Raw Sugar
    • Rubber
    • Soybean Oil
    • Silver
  • Forex
    • AUD
    • Bitcoin
    • CAD
    • CHF
    • Euro
    • GBP
    • INR
    • NZD
    • JPY
  • Raves
  • Consulting
    • Consulting
  • Ramki’s Watchlist
Top News

Has Meta (Facebook) stock seen the bottom

March 21, 2022

What Is The Nearest Technical Support For Meta (NASDAQ: FB)

February 7, 2022

Using Elliott Waves to Capture a Trade in S&P500

January 27, 2022
Facebook Twitter Instagram
WaveTimes Blog WaveTimes Blog
Wave times
  • About
  • Elliott Waves
    • Elliott Waves Explained
    • Elliott Wave Magic Illustrated with Wave Charts
    • Elliott Wave Edge – How Elliott Wave Traders Win
    • Fibonacci Number Series and Elliott Waves
    • How to use Fibonacci Ratio Retracements
    • Elliott Wave Books
      • The Elliott Wave Book – Five Waves to Financial Freedom
      • Dividend Growth Investing Using Elliott Waves
    • Videos
  • Equities
    • Indices
      • Africa
        • Egypt
      • Australia
      • European Indices
        • AEX – Index, Amsterdam
        • DAX Index
        • Istanbul
        • Russia
        • Spain’s IBEX 35
      • Asian Indices
        • India
        • China
        • Dubai
        • Kuwait
        • Kuala Lumpur
        • Pakistan
        • Saudi
        • Taiwan
      • US Indices
        • S&P500
        • Nasdaq
        • Dow Jones
        • Dow Jones Utilities
    • Stocks
      • Asian Stocks
        • Indian Stocks Trading
        • Dubai Stocks Outlook
        • Japanese Stocks
        • Kuwait stocks
        • Saudi Stocks Outlook
      • African Stocks
        • Egyptian Stocks
      • Swiss Stocks
      • Australian Stocks
      • European Stocks
      • US Stocks outlook
      • UK Stocks
  • Commodities
    • Copper
    • Gasoline
    • Gold
    • Natural Gas
    • Oil
    • Palm Oil
    • Raw Sugar
    • Rubber
    • Soybean Oil
    • Silver
  • Forex
    • AUD
    • Bitcoin
    • CAD
    • CHF
    • Euro
    • GBP
    • INR
    • NZD
    • JPY
  • Raves
  • Consulting
    • Consulting
  • Ramki’s Watchlist
WaveTimes Blog WaveTimes Blog
Home » NSEI update 30 Oct 2011
India

NSEI update 30 Oct 2011

RamkiBy RamkiOctober 30, 201122 Comments2 Mins Read
Facebook Twitter LinkedIn Telegram Pinterest Tumblr Reddit WhatsApp Email
Share
Facebook Twitter LinkedIn Pinterest Email

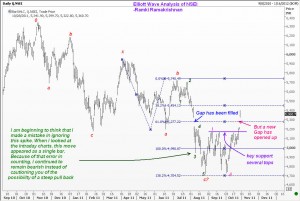
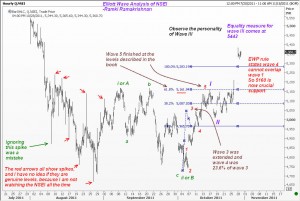
No matter how good your analysis your fate depends on your data! Occasionally, you might think your data is wrong, when it is indeed correct, and suffer a fate that is just as bad. I think (still not sure) I am in the latter camp as far as NSEI is concerned. As I often remind readers, WaveTimes is a place you come to learn, and verify your own ideas. I am not offering trading recommendations per se, but often present trading ideas. There is a subtle difference.

Take a look at the two charts here, and compare it with my recent update on the NSEI and you will see what is going on. Now the key question for some of you is are we finished with the correction and have we embarked on a new uptrend? Unfortunately, in the current position this question cannot be answered truthfully. However, I would continue to think that in the medium term, we will probably need to come down again. This is for two reasons. First, the double zigzag only corrected the prior impulse wave by about 38%. If we are going to embark on a new third wave after a shallow correction such as this, then that third wave will probably be an extension. Given the current economic and political situation in both India and the world in general, we should be very careful of anticipating a third wave at this juncture. Ralph Elliott has always recommended traders to be mindful of the broader fundamentals. With these reservations in mind, we should keep a watchful eye on 5160 because not only is it the top of wave 1 of the latest rally, but it is also the top of the first rally from the lows seen earlier in the year. Having said that, should the current third wave exceed 5450, and travel higher, the next resistance comes only around 5600.

India NSE NSEI
Share. Facebook Twitter Pinterest LinkedIn Tumblr Telegram Email
Previous ArticleElliott Wave update on EURUSD
Next Article Elliott Wave Analysis of Shanghai SE Composite Index Nov 2011
Ramki
  • Website

Related Posts

How Elliott Waves helped WaveTimes members to exit before the stock market crash

March 27, 2020

How we traded Castrol India using Elliott Waves

December 9, 2019

Nifty rallied up in 5 waves

July 10, 2015
View 22 Comments

22 Comments

  1. K.Thiruvadinatha Pillai on October 30, 2011 12:48 am

    sir,
    I purchased an e book of you Five waves to Financial Freedom and let me convey my thanks first as it has cleared many doubts i had in this matter.It is really informative .You have taught me how to treat the diagonal triangles and you have given examples of expanding diagonal triangles both leading and ending.Can you post an instance of Converging Diagonal Triangle.Also could you please explain with the chart the latest development in Nifty spot.

    Reply
  2. Vinod Kumar on October 30, 2011 1:26 am

    Hi Ramki:

    Thanks for the update. NSE has had lot of freak quotes and spikes regularly and easing of inflation and political situation could be the spike buster Ramki :).

    Reply
  3. bhavesh on October 30, 2011 2:07 am

    hi sir,
    i understand waves , but only UNDERSTAND if some one else puts his/her counts on a chart.
    anyways, with my limited knowledge regarding wave counts, i put my experience behind my analysis, as i too identified 4538 as an important target and a strong bounce back level for NIFTY i found 8500 level for CNX BANK NIFTY and i as i found that BANK NIFTY touched 8600 but NIFTY didnt breach 4720 in the same down leg, i became cautious and i predicted 5340 once above 4926/5034 on 7th october.
    positive divergance and candle reversal pattern helped me .
    here it is
    http://bhoom2tika.blogspot.com/2011/10/weekly-technical-view_09.html

    Reply
    • Ramki on October 30, 2011 2:44 am

      Bhavesh, you are doing good. Stop worrying about being perfect with wave counts. Concentrate instead on getting the method right and finally stop making predictions unless you wish to become a professional forecaster (with its attendant problems!) You can probably make more money in trading it for yourself. I do wavetimes as a hobby, by the way (at least for now)

      Reply
  4. BJ on October 30, 2011 3:50 am

    Dear Ramki,

    Once again sensex is the clue here, it broke the low of red i by 20 points at red ii. So it is very likely that 5160 is going to overlap and your earlier count is probably the right count.

    Best regards,
    BJ

    Reply
  5. Aniruddha on October 30, 2011 5:21 am

    Dear Sir,

    I apologize for what I am saying beforehand. But your latest count of NSEI lack the usual confidence that we are used to read in your analysis. But your analysis is not the only thing we get out from this website. You have also stated in your book that if you are in doubt its better to stay out. I am a happy owner of your eBook, and must say the book has brought a certain clarity in my interpretation of markets. I also maintain a website and record my analysis of different markets on it, you can encourage me by visiting it. Only if you can manage to find some time out of your busy schedule. You are already doing a great job for all of us, who sincerely want to learn. http://www.profitfromstockmarkets.com

    Regards
    Aniruddha

    Reply
  6. Abhilasha on October 30, 2011 7:13 am

    Ramki ji,

    I was about to point exactly what BJ has pointed out. Sensex’s wave 2 voilates EW guidelines. Hence we may have to revise counts.

    Reply
    • Ramki on October 30, 2011 11:24 am

      Abhilasa, BJ, Anirudh and others. With the help of Suresh, one of our wavetimes club members, I will be presenting you all with a forum in the next couple of days. Then you all can freely exchange ideas there!

      Reply
      • BJ on November 1, 2011 6:13 am

        Dear Ramki,

        Please do not have that forum. It will be additional admin time for you. I have seen people turn useful forums to push personal agenda’s, promote their website/product etc etc and ofcourse those 1 out of 10 juvenile guys turning into a slugfest and name calling competition.

        Best regards,
        BJ

        Reply
        • Ramki on November 1, 2011 11:57 pm

          BJ, I really appreciate what you have said. However, I am getting some of my close friends to act as moderators of the forum, and they will bump off anyone who becomes a nuisance. FOr the rest of us, serious people who wish to exchange ideas and learn from each other, the forum will be a great place. It should be live tomorrow, I am hoping. One of WaveTimes club members, Suresh, from Belgium, is helping me with setting up the forum.

          Reply
  7. Ashwin on October 30, 2011 7:25 am

    Hi Ramki,

    I have been an ardent follower of your blog. With regards to your question on Spikes in Nifty. I believe that the OHLC bars include pre opening data. So you are seeing those spikes. Pre-opening session happens between 9.00 to 9.15 AM, during which there is a lot of volatility in prices. Ideally i consider only the pre-opening settlement price for that day as opening price. some software providers consider the entire 15 min session along with the activity for day.So considering this would like to know if there is any change in view.
    Thanks.
    Ashwin.

    Reply
    • Ramki on October 30, 2011 11:22 am

      Hi Ahswin, you have the data and you know my methods! So I m gong to leave it to you now to interpret it. My problem is gon back to same chart again will use up another 30 minutes of my time……

      Reply
  8. Rohit on October 31, 2011 12:07 am

    Why cant the fall from the high in september to the low in october be an ending diagonal? Wave 5 then could end there. Am I missing something?

    Reply
    • Ramki on October 31, 2011 2:23 am

      Rohit, you are not missing anything. On the contrary, you are seeing things which is not clear to some others! Are you happy about the internal waves of the diagonal triangle (refer Fives Waves to Financial Freedom). If yes, you may have a case.

      Reply
  9. K P Ganesh on October 31, 2011 7:21 am

    Guess Nifty has broken upwards. Wave B (corrective wave). Looking at the charts of some heavyweights like Reliance and Hindalco (which shot up 10% on closing basis), guess a near 50% to 61.8% retracement is on the cards.

    Reply
  10. Parimal Devnath on November 1, 2011 6:44 am

    Hi Ramki-ji
    for last many days i was desperately searching for a web/blog on EW for Nifty. and now i am quite happy to see your site. gradually i shall learn from you, i hope.
    thank you for your very nice site and teaching
    i am interested in buying your E-book an tried also but could not. please help and oblige

    best of regards

    Reply
    • Ramki on November 2, 2011 12:00 am

      Hello Parimal, welcome to the club. You will learn not only from this blog, but also from others who will be posting in the forum very soon. As for the book, click on the image of the book and follow the guidance given there.

      Reply
  11. bhavesh on November 1, 2011 6:42 pm

    Hi sir, after reading “ABOUT RAMKI “, i am proud to be an indian .
    if NIFTY closes below 5156 on any day the short term BULLISH counts be changed sir ?

    Reply
  12. Parimal Devnath on November 2, 2011 6:51 am

    Hello Ramkiji
    thanks for your kind response. i am quite keen on learning EW theory.
    i clicked on the book, it leads to Kindle etc. actually i want it in printed form. please help me purchasing the book in printed form.
    thanks again and kind regards
    Parimal

    Reply
    • Ramki on November 2, 2011 9:27 am

      Hi Parimal, sorry you are out of luck. It is only available in digital format because there are numerous cross references in it that are invaluable to the reader seeking to learn Elliott wave theory.

      Reply
  13. Pankaj on November 11, 2011 2:36 am

    5160 got taken out on the nifty today. Does this mean that an overlap has occurred and wave C is over? If true then by re-labeling we just finished wave 2 of larger wave C starting from 5750. What would be the possible end points of wave C then ?

    Reply
    • Ramki on November 11, 2011 8:56 pm

      Hi Pankaj, I will take a look when I return, but this type of a question can be discussed in the forum too, as others will be able to join in.

      Reply

Leave A Reply Cancel Reply

Recent Posts
  • Has Meta (Facebook) stock seen the bottom
  • What Is The Nearest Technical Support For Meta (NASDAQ: FB)
  • Using Elliott Waves to Capture a Trade in S&P500
  • Hedge Funds and Elliott Waves – Netflix $NFLX
  • When Elliott Waves applauds the promoter’s signals!

WaveTimes is a Research Organization dedicated to providing original analysis, reports, reviews, and insights on developments in mutual funds, stocks, investing, foreign exchange, commodities, and bonds.

Contact WaveTimes

L-601 Mantri Espana,

Kariyammana Agrahara, Bellandur, Bangalore 560103

Follow Us

  • Facebook
  • YouTube
  • Twitter

© 2023 Wave Times. All Rights Reserved.
  • About
  • Books
  • Privacy Policy
  • Policies and Standards

Type above and press Enter to search. Press Esc to cancel.