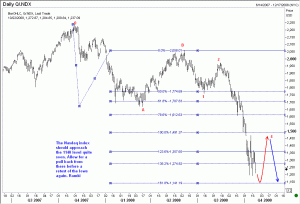
I believe we will reach 1140 in the NASDAQ not too long from now. Not only is that level a 161.8% projection of Wave A computed from the top of Wave B, it also coincides with a projected target for the 5th wave of the C wave. Trader Mike had suggested that we could be forming a symmetrical triangle pattern, which means the next leg down will come once the triangle is resolved. However, it looks to me like the index has posted two lows about the same level (actually the 2nd low was a tiny bit lower than the first). In the big picture it hardly matters whether this is a symmetrical triangle or not, because we agree on the direction. Also, trying to predict the path of a move is downright risky. Most successful traders don’t care to ‘predict’ how a pattern will evolve. They take buy and sell signals at levels which suit their risk appetite and when their system says ‘go’.

However, it is often useful to have a framework with which to trade. For example, if we go lower to 1140, and the market seems to pause there, I might take back any shorts I have because my wave analysis considers the possibility of a recovery before down again. Anyway, here is your Nasdaq chart. Study it and learn by comparison with actual fact after the moves take place. Best. Ramki

