• About
  • Elliott Waves
    • Elliott Waves Explained
    • Elliott Wave Magic Illustrated with Wave Charts
    • Elliott Wave Edge – How Elliott Wave Traders Win
    • Fibonacci Number Series and Elliott Waves
    • How to use Fibonacci Ratio Retracements
    • Elliott Wave Books
      • The Elliott Wave Book – Five Waves to Financial Freedom
      • Dividend Growth Investing Using Elliott Waves
    • Videos
  • Equities
    • Indices
      • Africa
        • Egypt
      • Australia
      • European Indices
        • AEX – Index, Amsterdam
        • DAX Index
        • Istanbul
        • Russia
        • Spain’s IBEX 35
      • Asian Indices
        • India
        • China
        • Dubai
        • Kuwait
        • Kuala Lumpur
        • Pakistan
        • Saudi
        • Taiwan
      • US Indices
        • S&P500
        • Nasdaq
        • Dow Jones
        • Dow Jones Utilities
    • Stocks
      • Asian Stocks
        • Indian Stocks Trading
        • Dubai Stocks Outlook
        • Japanese Stocks
        • Kuwait stocks
        • Saudi Stocks Outlook
      • African Stocks
        • Egyptian Stocks
      • Swiss Stocks
      • Australian Stocks
      • European Stocks
      • US Stocks outlook
      • UK Stocks
  • Commodities
    • Copper
    • Gasoline
    • Gold
    • Natural Gas
    • Oil
    • Palm Oil
    • Raw Sugar
    • Rubber
    • Soybean Oil
    • Silver
  • Forex
    • AUD
    • Bitcoin
    • CAD
    • CHF
    • Euro
    • GBP
    • INR
    • NZD
    • JPY
  • Raves
  • Consulting
    • Consulting
  • Ramki’s Watchlist
Top News

Has Meta (Facebook) stock seen the bottom

March 21, 2022

What Is The Nearest Technical Support For Meta (NASDAQ: FB)

February 7, 2022

Using Elliott Waves to Capture a Trade in S&P500

January 27, 2022
Facebook Twitter Instagram
WaveTimes Blog WaveTimes Blog
Wave times
  • About
  • Elliott Waves
    • Elliott Waves Explained
    • Elliott Wave Magic Illustrated with Wave Charts
    • Elliott Wave Edge – How Elliott Wave Traders Win
    • Fibonacci Number Series and Elliott Waves
    • How to use Fibonacci Ratio Retracements
    • Elliott Wave Books
      • The Elliott Wave Book – Five Waves to Financial Freedom
      • Dividend Growth Investing Using Elliott Waves
    • Videos
  • Equities
    • Indices
      • Africa
        • Egypt
      • Australia
      • European Indices
        • AEX – Index, Amsterdam
        • DAX Index
        • Istanbul
        • Russia
        • Spain’s IBEX 35
      • Asian Indices
        • India
        • China
        • Dubai
        • Kuwait
        • Kuala Lumpur
        • Pakistan
        • Saudi
        • Taiwan
      • US Indices
        • S&P500
        • Nasdaq
        • Dow Jones
        • Dow Jones Utilities
    • Stocks
      • Asian Stocks
        • Indian Stocks Trading
        • Dubai Stocks Outlook
        • Japanese Stocks
        • Kuwait stocks
        • Saudi Stocks Outlook
      • African Stocks
        • Egyptian Stocks
      • Swiss Stocks
      • Australian Stocks
      • European Stocks
      • US Stocks outlook
      • UK Stocks
  • Commodities
    • Copper
    • Gasoline
    • Gold
    • Natural Gas
    • Oil
    • Palm Oil
    • Raw Sugar
    • Rubber
    • Soybean Oil
    • Silver
  • Forex
    • AUD
    • Bitcoin
    • CAD
    • CHF
    • Euro
    • GBP
    • INR
    • NZD
    • JPY
  • Raves
  • Consulting
    • Consulting
  • Ramki’s Watchlist
WaveTimes Blog WaveTimes Blog
Home » Nasdaq: Value Averaging For The Long Haul
Nasdaq

Nasdaq: Value Averaging For The Long Haul

RamkiBy RamkiAugust 16, 20094 Comments2 Mins Read
Facebook Twitter LinkedIn Telegram Pinterest Tumblr Reddit WhatsApp Email
Share
Facebook Twitter LinkedIn Pinterest Email

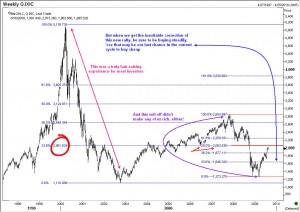
Nasdaq 16Aug09Have you kicked yourself for having missed the superb rally of the 1990s in Nasdaq? More likely you have kicked yourself for buying stocks on the way down, only to see it go even lower! Ditto for the rally between 2003-2008 and the collapse that followed. What are we poor blighters supposed to do? Precisely when we gather up enough courage to start buying, the market starts its descent. And while we listened to all the fear mongering and did nothing, the market went up. Perhaps the answer lies in value averaging? There is a nice book written by Michael Elseson on this subject, and would you believe it, for some years the book was actually selling for more than its listed price beause it had gone out of print. Anyway, the concept is simply to marry dollar-cost averaging and rebalancing. The Nasdaq index would undoubetdly start its correction sometime in the future. When the correction starts, we should start buying steadily for similar amounts every month. That way, we would be holding a nice portfolio at an average cost somewhere in the middle of the range of the correction. EVentually, when the third wave starts, (or call it “C” wave if you like – it doesn’t matter which if you are looking for higher prices in the medium term), you will be smiling, and remembeing this post in Wavetimes!

Nasdaq index
Share. Facebook Twitter Pinterest LinkedIn Tumblr Telegram Email
Previous ArticleGulf Bank Kuwait: Eliott Wave Analysis
Next Article India dreams on while China wakes up
Ramki
  • Website

Related Posts

A closer look at Nasdaq chart

December 3, 2008

What is a significant rally in the stock markets?

November 30, 2008

Nasdaq Top 100 index reviewed

November 9, 2008
View 4 Comments

4 Comments

  1. david on September 7, 2009 1:26 pm

    Hi,

    Not sure i follow you , are you calling a bottom in tech stocks ? Regarding the SPX count i think we are completing a B wave or Primary 2 doesnt really mattter.. entering the final 5 now i reckon. I prefer the notion of P2 and in that instance we are making a classing abc with us about to enter wave 3 of C up of said ABC.

    Reply
    • Ramki on September 7, 2009 9:48 pm

      Hi David,

      In this specific post, I was suggesting that those who wish to play from the “long” side in Nasdaq stocks should accumulate in stages when we get the eventual correction. The reason is, we will experience a more powerful wave up post the correction. That move could be either a 3rd wave, or a C wave, it doesn’t matter what label we apply at this time. Bear in mind that the correction could be deep, which is another reason why we should accumulate on stages.

      Reply
  2. Shiva on February 24, 2012 11:51 am

    Hi Sir
    Where do we stand in this correction? Looks like SPY is close to the target you called 1376 and qqq had a solid rally from your last call. Are you updating these when you are back? Thx for all the education

    Shiv

    Reply
    • Ramki on February 25, 2012 9:25 pm

      Shiva, yes, I will look at the markets when I return in a few days

      Reply

Leave A Reply Cancel Reply

Recent Posts
  • Has Meta (Facebook) stock seen the bottom
  • What Is The Nearest Technical Support For Meta (NASDAQ: FB)
  • Using Elliott Waves to Capture a Trade in S&P500
  • Hedge Funds and Elliott Waves – Netflix $NFLX
  • When Elliott Waves applauds the promoter’s signals!

WaveTimes is a Research Organization dedicated to providing original analysis, reports, reviews, and insights on developments in mutual funds, stocks, investing, foreign exchange, commodities, and bonds.

Contact WaveTimes

L-601 Mantri Espana,

Kariyammana Agrahara, Bellandur, Bangalore 560103

Follow Us

  • Facebook
  • YouTube
  • Twitter

© 2023 Wave Times. All Rights Reserved.
  • About
  • Books
  • Privacy Policy
  • Policies and Standards

Type above and press Enter to search. Press Esc to cancel.