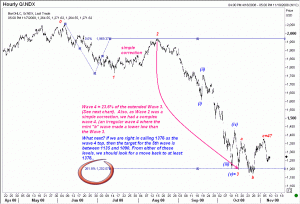
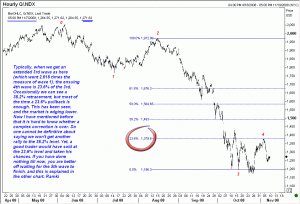
A few days back (23 Oct. to be precise) I posted the chart of the Nasdaq top 100 index while referencing to Trader Mike’s post of a potential symmetrical triangle in the Nasdaq Composite index. I figured that it is time to take a look at that chart again. There are two charts posted here and you might find it worthwhile to spend some time studying both. Basically I still think we will see around 1140 in the Nasdaq 100 ( which roughly corresponds to 1400 in the composite). The rest of the comments appear on the accompanying charts.
Nasdaq Top 100 index reviewed

Unleash your Potential
Transform your trading – Starting Today

